


Projected ARC and PLC Payments for 2025
The ARC and PLC programs for 2025 are currently projected to make over $13.5 billion in payments. Those payments will be made in October 2026. A challenge facing policymakers is to balance the immediate need for financial assistance facing many farm operations with the fact that 2025 ARC/PLC payments will not be determined and paid until next year.
Projected Payments for 2025
Modifications to the ARC and PLC programs included in the One Big Beautiful Bill (OB3) reconciliation package signed into law on July 4, 2025 take effect for the 2025 crop year. Those changes have been discussed in more detail in previous articles (see farmdoc daily articles from July 3 and July 15, 2025). Relative to the 2018 Farm Bill, changes to ARC and PLC in OB3 increase the likelihood and potential size of payments in 2025 and future years. In addition, since enrollment decisions for 2025 were made prior to passage of OB3, farmers will receive the larger of either the PLC or ARC payment in 2025. Enrollment decisions will again matter beginning in 2026.
Projected marketing year average (MYA) prices for 2025/26 used to arrive at the payment estimates are based on USDA projections in the latest WASDE report and ARC/PLC program data provided by the Farm Service Agency (FSA), both of which were updated and released on November 14th, 2025.
Per acre payment rate estimates for both ARC-CO and PLC are computed using simulation methods (see the Policy Design Lab webpage for additional visualizations of projected ARC-PLC payments). County-level data on enrolled base acres from FSA is then used to aggregate the maximum of the ARC and PLC program payment rates for each county to total payment estimates. For ARC-CO, non-irrigated yields are considered for counties where practices are separated.
The total payment estimates for seven of the largest (in terms of base acreage) commodities, which cover 95% of 2025 enrolled base acres, are provided in Table 1. Total ARC and PLC payments are projected to exceed $13.5 billion for these commodities for the 2025 crop year.
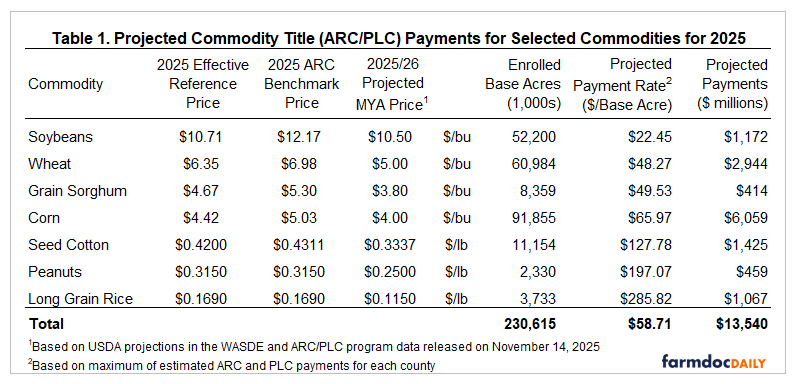
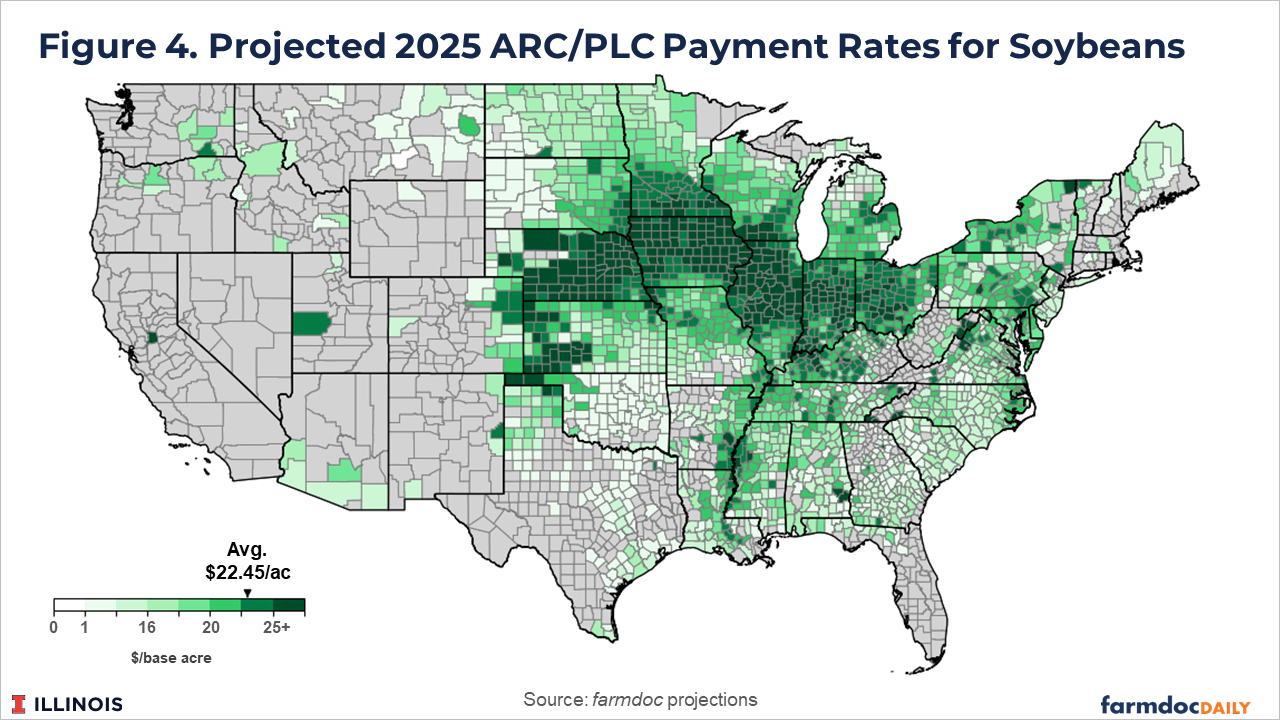
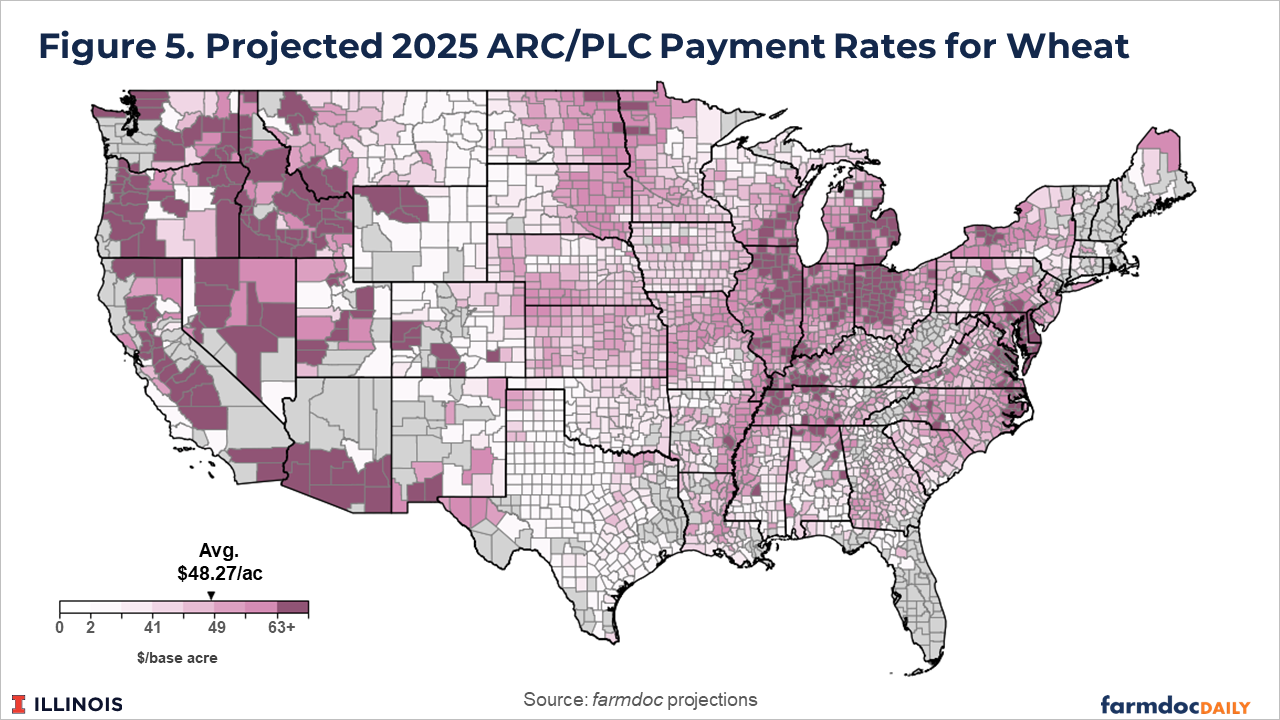
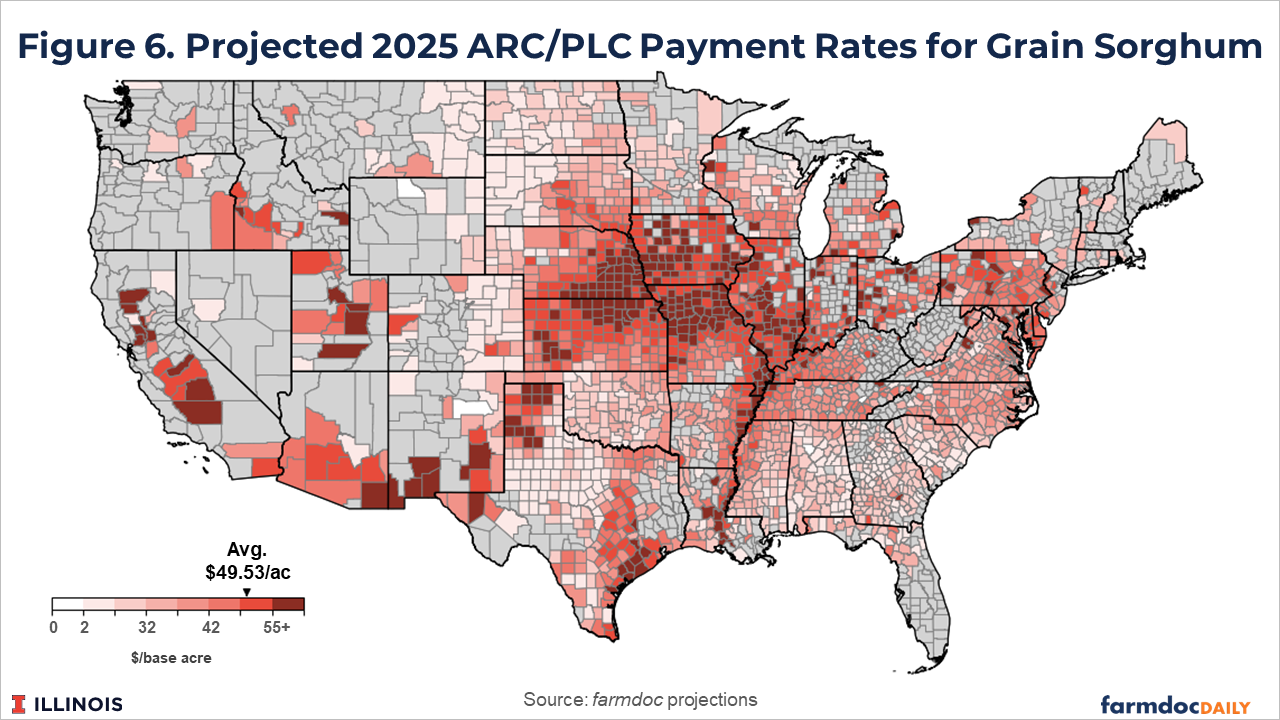
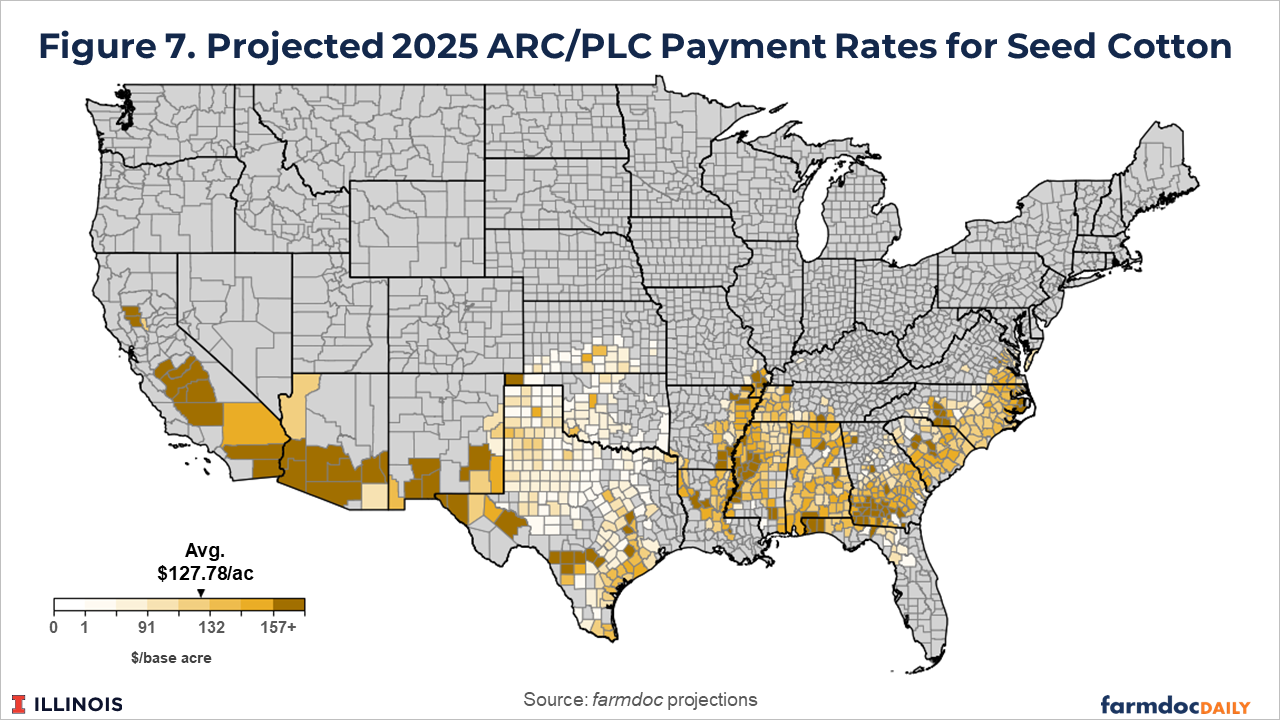
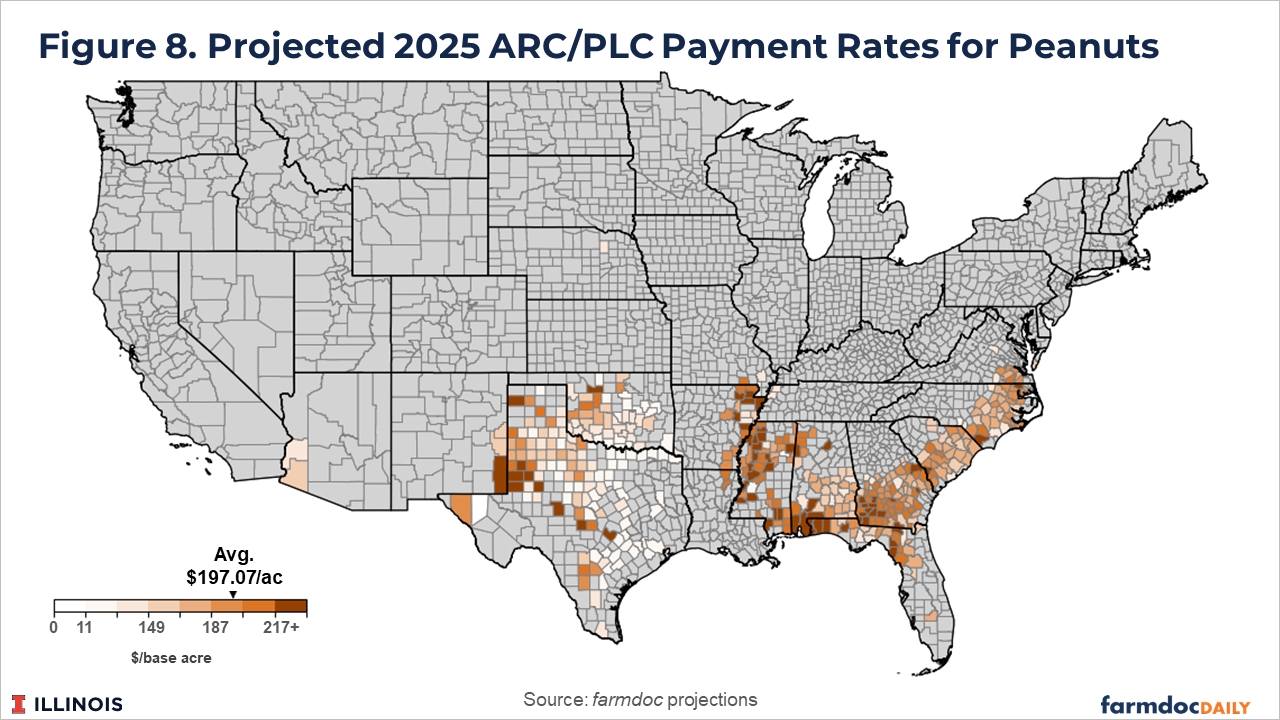
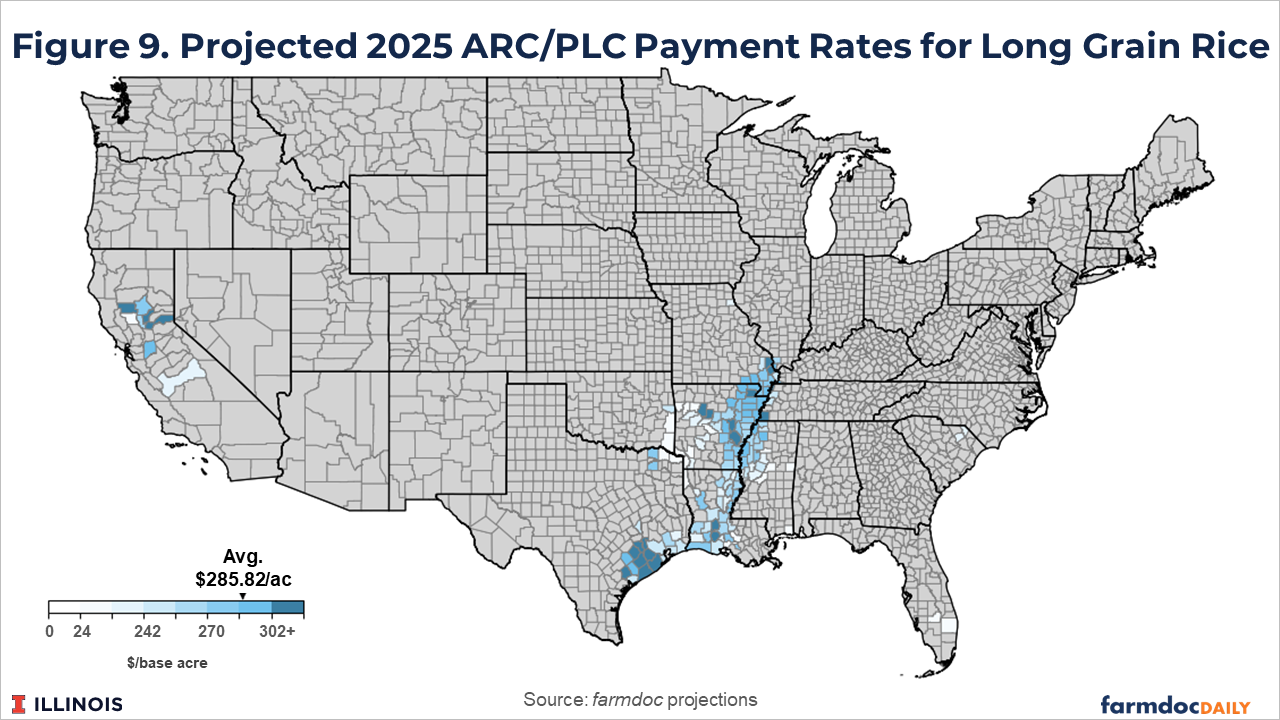
On a per acre basis (see Figure 1), projected payments are nearly $286 per base acre for long grain rice while peanuts are projected to receive close to $200 per base acre. Seed cotton acres are projected to receive just under $128 per base acre. Corn is projected to receive nearly $66 per base acre with grain sorghum and wheat projected to each receive just under $50 per base acre. Payments to soybeans are projected at just over $22 per base acre for 2025.
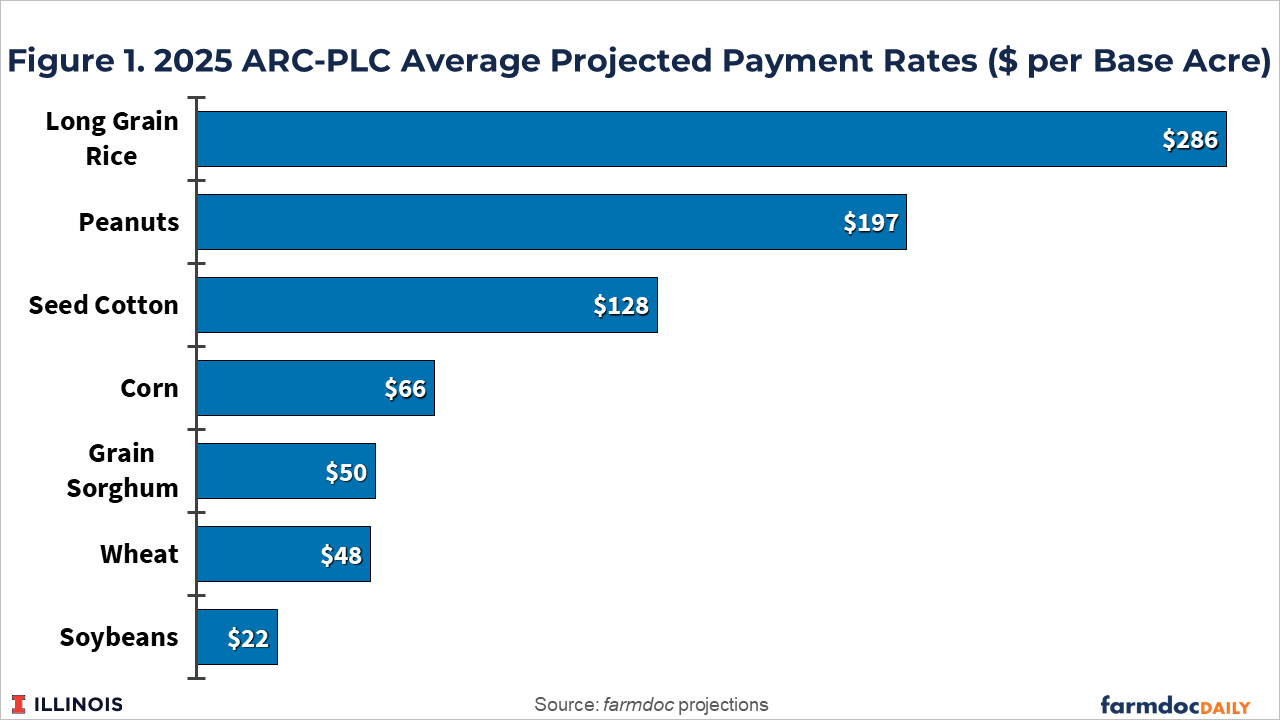
The larger average payment rates for rice, peanuts, and seed cotton coincide with the higher effective reference and ARC benchmark prices those commodities have compared with their 2025 MYA price projections. For example, the effective reference price (and ARC benchmark price) for peanuts is 47% higher than the projected MYA price for 2025. For soybeans, the effective reference price is just 2% higher, and the ARC benchmark is 16% higher, than the projected 2025 MYA price.
Payments to corn base are projected to reach just over $6 billion on more than 90 million base acres. Payments to wheat are projected to be more than $2.9 billion on nearly 61 million base acres. Seed cotton payments are projected to be $1.4 billion on 11.1 million base acres; projected payments to soybeans (52.2 million base acres) and long grain rice (3.7 million base acres) both exceed $1 billion. Grain sorghum (8.3 million base acres) and peanuts (2.3 million base acres) are projected to receive over $400 million in payments each.
County-level Payment Rates
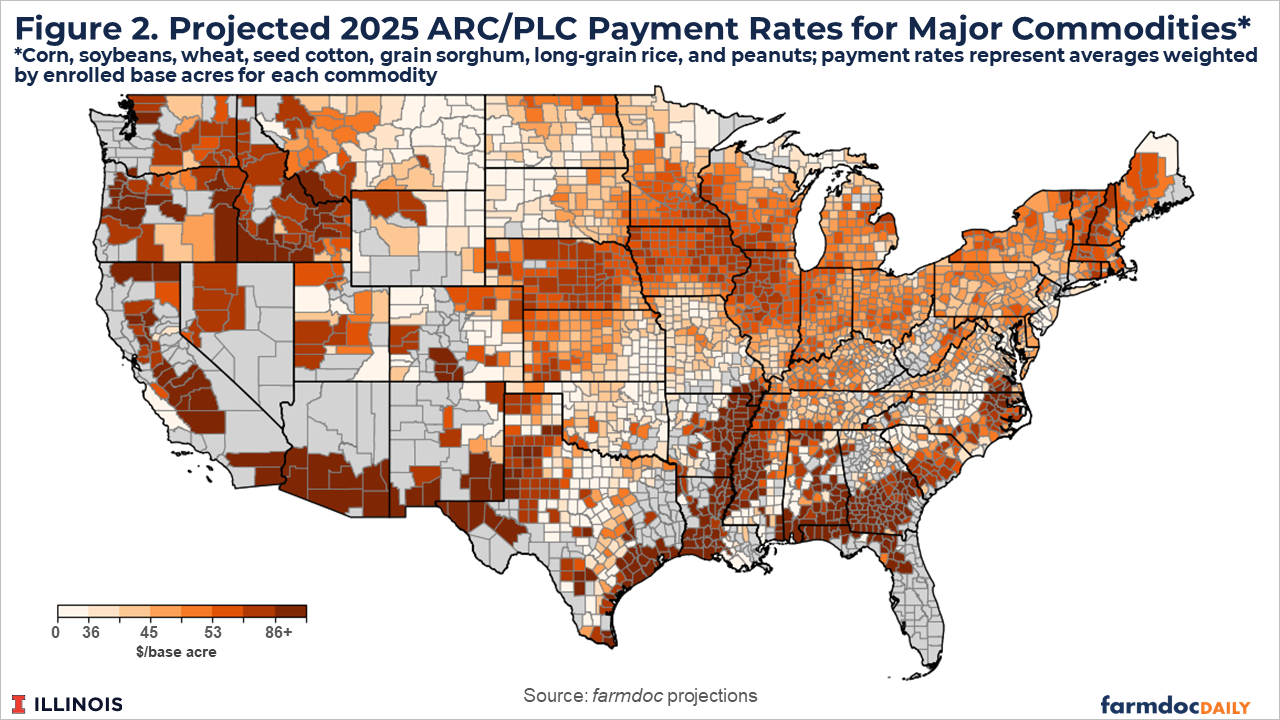
Figure 2 illustrates the variability in county-level payment rates averaged across the seven commodities included in Table 1. Per base acre payment rates are projected to be largest in parts of the southern US where rice, seed cotton, and peanut base acres are located. Payment rates exceeding $50 per base acre are prevalent in counties in Nebraska, Iowa, the northern half of Illinois and the southern regions of Minnesota and Wisconsin – areas of the Midwest with mostly corn and soybean base acres. Lower projected payments rates exist in other areas where base acres are more distributed across wheat, soybeans, corn, and sorghum. Note that other program crops not included in these projections (i.e. barley, oats, other oilseeds, etc.) would impact the average payment rates for counties with base acres in those crops.
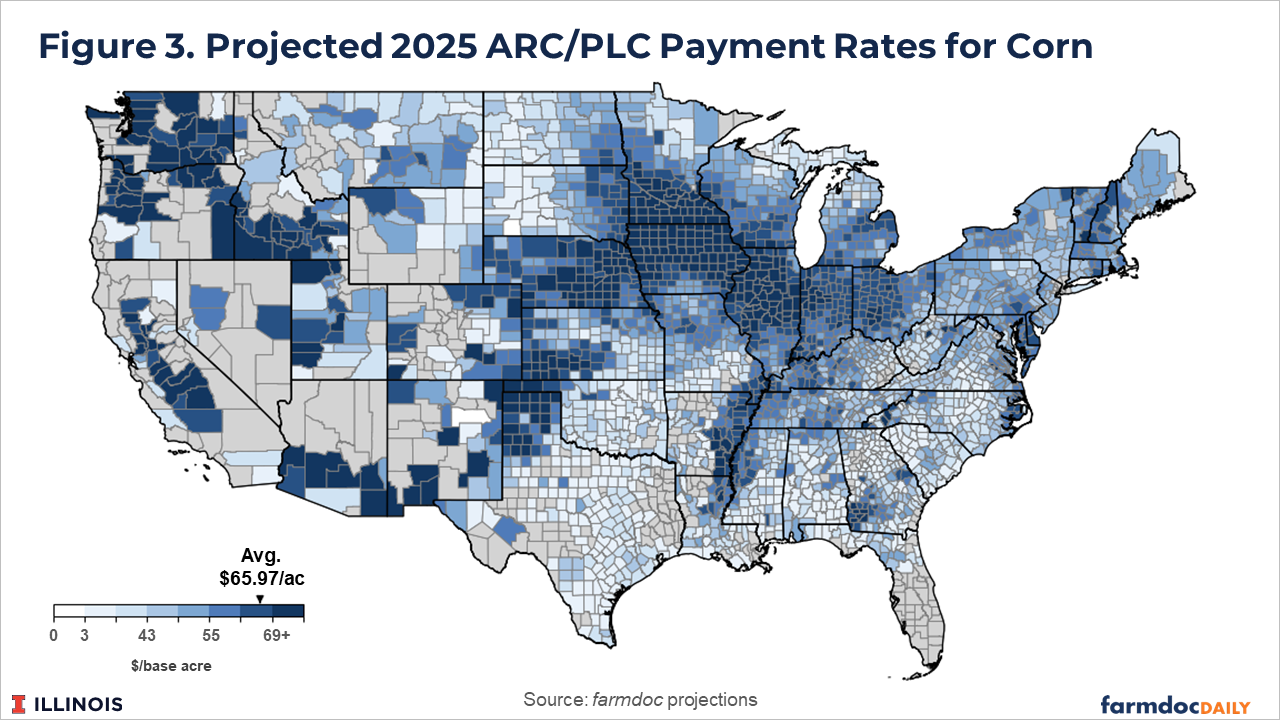
Figures 3 through 9 show county-level projected payment rates for the individual commodities included in Table 1. The payment rate maps illustrate where base acres for the commodities are located and the significant variation in payment rates that exists across counties even for individual commodities. The projected payment rates tend to be higher in areas of relatively high historical productivity for each crop. Higher productivity implies larger PLC payment yields and also larger ARC-CO yield benchmarks – both of which increase the potential size of payments when triggered. Areas with greater relative yield variability (or yield risk) also tend to have higher payment rates as greater yield variability translates to an increased likelihood of triggering ARC-CO payments due to yield declines.
Discussion
The ARC and PLC programs resulting from the passage of the OB3 reconciliation bill provide the potential for large support payments. This is particularly true for 2025 with farmer’s receiving the larger payment from the programs regardless of their enrollment decisions made in March. The latest price projections from USDA suggest ARC and PLC payments could exceed $13.5 billion for 2025. Projected payment rates per base acre range from just over $22 per base acre for soybeans to nearly $286 per base acre for long grain rice.
Despite the strengthened ARC and PLC program designs and payment projections for 2025, low commodity prices relative to elevated production costs continue to imply relatively low to negative average returns for major row crops. Furthermore, the projected assistance from ARC and PLC for 2025 would not be provided until October of 2026. Poor row crop returns since 2023 have created a situation of increasing financial stress for many operations. Additional ad hoc funding for 2025, often referred to as bridge funding, continues to be discussed at the federal level (examples here and here).
While the need for support for many farm operations is both real and immediate, caution should be taken by policymakers in determining how any additional assistance should be allocated over the next few months. Safety net payments for the 2024 crop year began with some crop insurance payments being made and Emergency Commodity Assistance Program (ECAP) payments being authorized at the end of 2024 and are still ongoing with 2024 ARC/PLC payments and additional disaster assistance being processed this fall. The length of time over which support payments are made for a specific crop year creates significant challenges in determining need and providing support in a targeted and timely manner to producers (see farmdoc daily article from October 16, 2025 for further discussion). Significant additional ad hoc support could lead to higher costs, or at least reduced pressures to lower costs, and a continuing cycle of calls for additional support in future crop years.
References
Monaco, H., J. Coppess, N. Paulson and G. Schnitkey. "Farm Bill in Reconciliation: ARC/PLC Payment Projections; Policy Design Lab Update." farmdoc daily (15):122, Department of Agricultural and Consumer Economics, University of Illinois at Urbana-Champaign, July 3, 2025.
Schnitkey, G., N. Paulson, C. Zulauf and J. Coppess. "Impacts of the Commodity Title Changes Under the One Big Beautiful Bill Act (OBBBA) for Midwestern Farms in 2025." farmdoc daily (15):128, Department of Agricultural and Consumer Economics, University of Illinois at Urbana-Champaign, July 15, 2025.
Zulauf, C., J. Coppess, N. Paulson and G. Schnitkey. "2024 Crop Safety Net Payments: Performance of Contemporary Ad Hoc Assistance." farmdoc daily (15):191, Department of Agricultural and Consumer Economics, University of Illinois at Urbana-Champaign, October 16, 2025.
Disclaimer: We request all readers, electronic media and others follow our citation guidelines when re-posting articles from farmdoc daily. Guidelines are available here. The farmdoc daily website falls under University of Illinois copyright and intellectual property rights. For a detailed statement, please see the University of Illinois Copyright Information and Policies here.