


Should US Growers Look to Africa as the Next Big Market? Understanding Africa’s Food and Oil Demand Trends
The Soybean Innovation Lab (SIL) introduces readers to the question whether Sub Saharan Africa (SSA) presents a new market opportunity for US soybean growers. Over the next three weeks SIL and farmdoc will deliver three articles on the topic of Africa as a potential export market for US soybeans. The African market presents a very complex landscape. While it is large, diverse, and growing rapidly, there exists great uncertainty, significant business risks, and demand for soybean and associated products are just beginning to emerge.
This first article in the series focuses on the larger food and oil trends dominating the African continent. The second article will delve into the import flows of soybean, oil, and meal into Africa. The third article will wrap up the series by outlining four specific country examples – Egypt, Ghana, Nigeria, and Tanzania – touching on their imports of soy and soy products, logistics infrastructure, and existing policies on genetically modified soybean imports. The third and final article will also include a relevant literature review on the subject of soy trade and Africa.
Food Import Demand in SSA
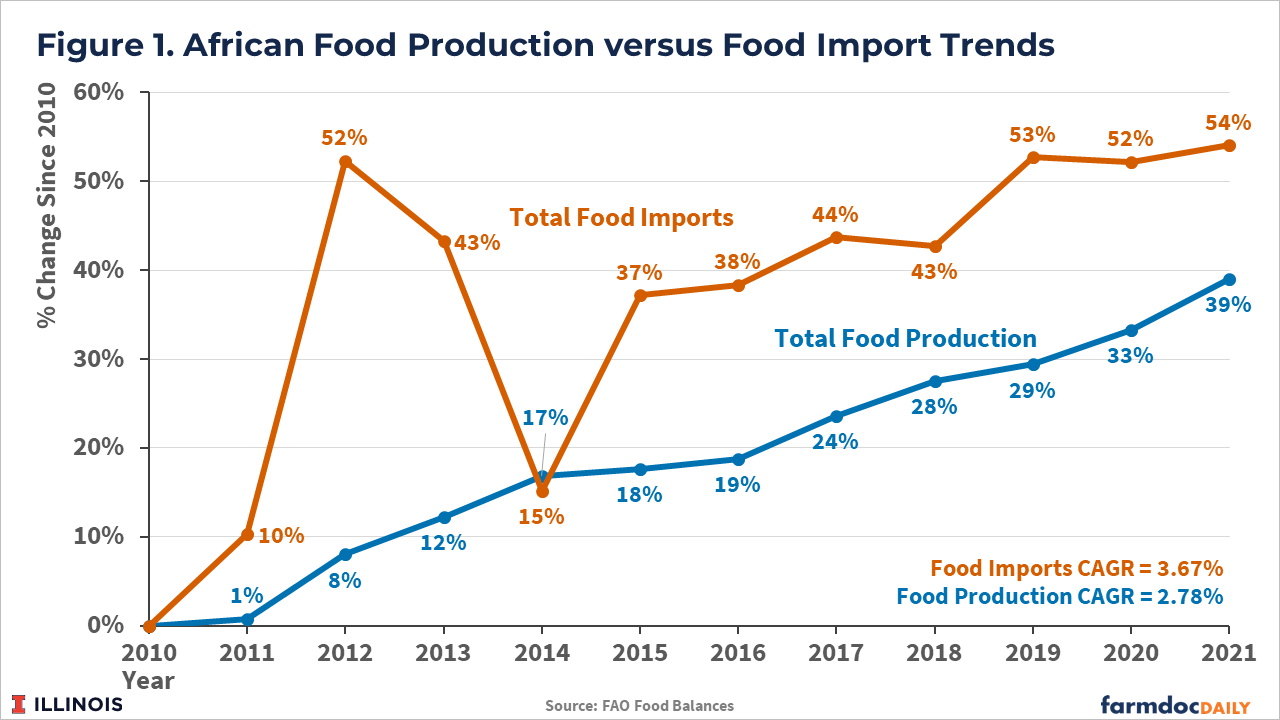
Will SSA require food imports to meet its fast-growing needs? The answer is yes. Food imports rose significantly faster (32%) than food production from 2010 to the present in Africa (Figure 1). The gap between production and imports reflects a significant and growing new market opportunity for the world’s major commodity exporters, such as the US. The compound annual growth rate (CAGR) for food production is 2.78% while food imports are rising at a rate of 3.67% per annum. The rapid rise in demand for imported food, which far outstrips population growth, reflects both changing preferences for food imports as well as rising incomes allowing for the purchase imports.
Food Oil Use in SSA
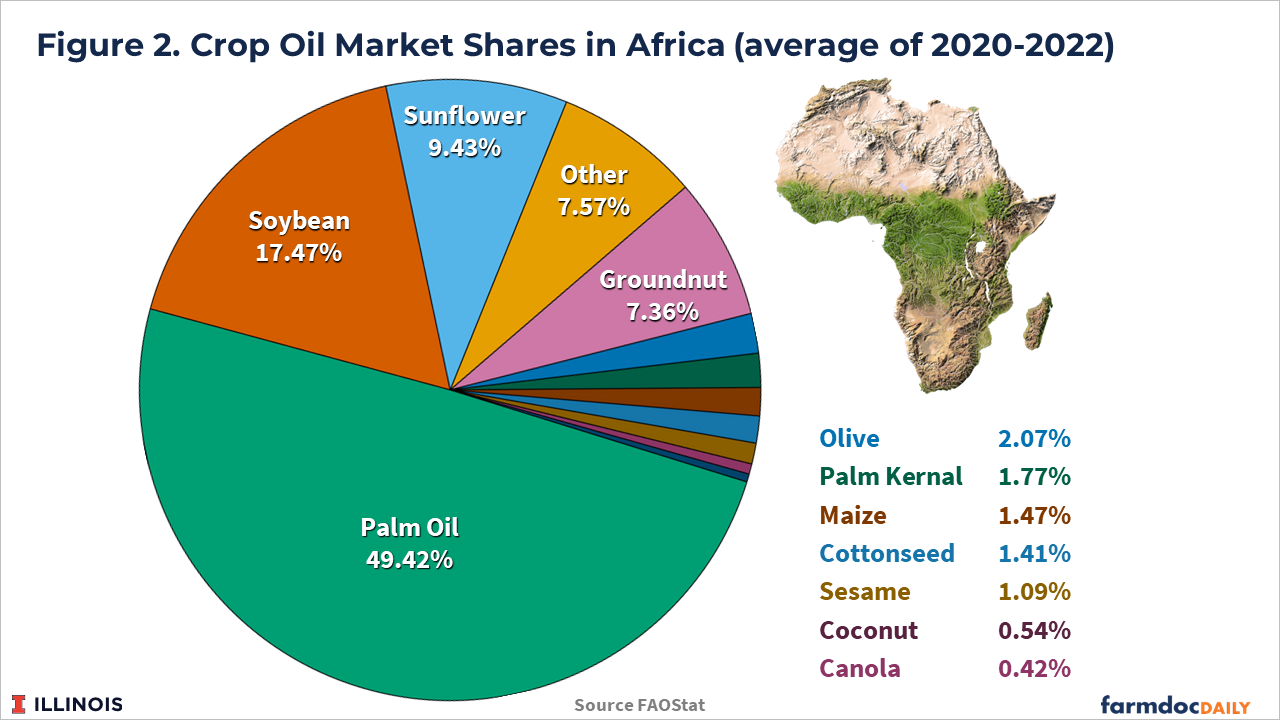
The metric “food oil market share” reflects the percentage of all food oil used for household and commercial use in a particular country or region. The higher the percentage, the greater the oil assumes the role of the region’s industrial standard. Currently soybean oil does not hold the position as the industrial standard in Africa. Soy still lags as the industrial food oil with only 17% market share of the domestic oil supply compared with palm oil that has a market share of 49% (Figure 2). Therefore, US soy product exports cannot readily and seamlessly flow into the various industrial sectors as a raw material because equipment, recipes, formulations, and supply chains center on imported palm oil.
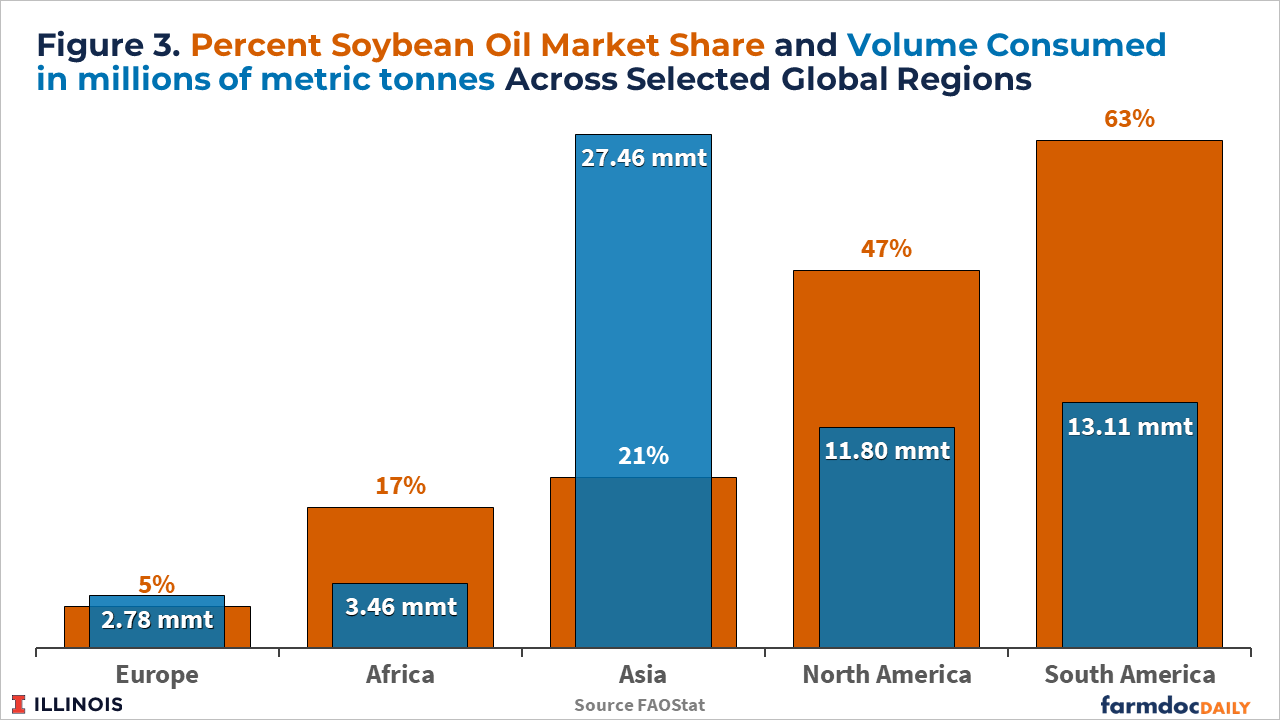
Soybean oil realizes very high utilization levels in North America, South America, and Asia with market shares of 47%, 63%, and 21%, respectively (Figure 3). Asia presents the largest market for soybean oil utilizing 27 million metric tons annually. Low oil market share/low volumes present a negative knock on affect for feed/protein markets as livestock producers cannot adopt the corn:soybean ration as their industrial standard due to the limited availability of soybean meal. The goal for US exporters should be to elevate market share so processors, manufacturers, and livestock producers can commit their industrial equipment, operational processes, recipes, and formulations to soybean/oil/meal as a raw material.
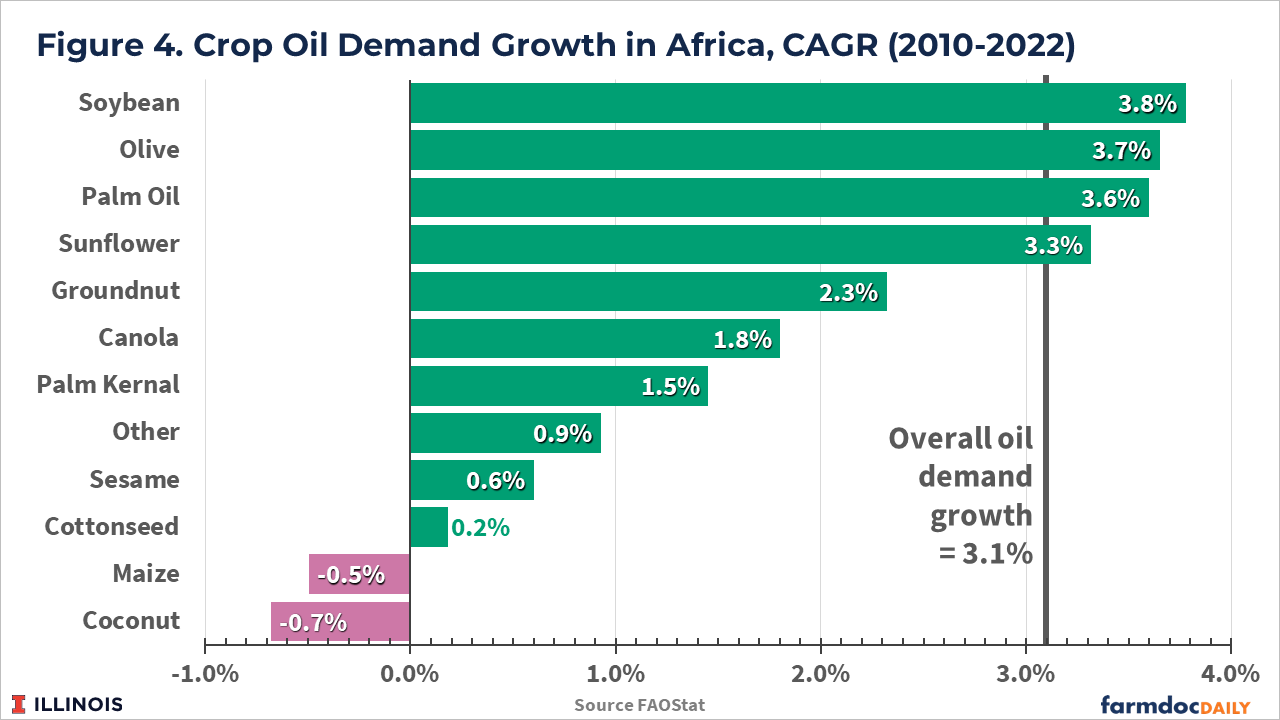
Industrial demand for all oils has been rising at a CAGR of 3.1% since 2010. Soybean oil, as the second largest food oil in Africa by volume, has outpaced overall growth in the oil market by 23% and leads all oils with an annual growth rate of 3.8% (Figure 4). Soybean oil growth has exceeded that of sunflower (by 14%) and palm (by 5%). These shifts bode well for future demand for soy oil from the industrial sector.
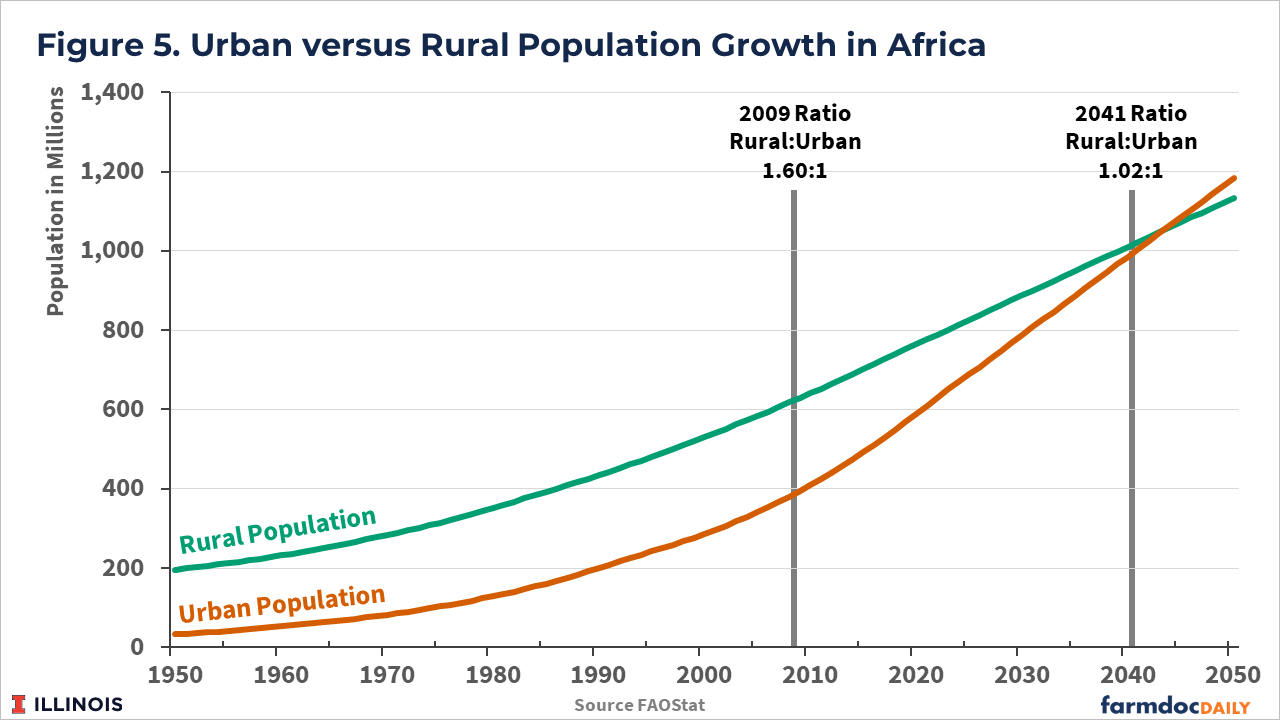
Urban and Rural Population Growth in SSA
Finally, we look at the high rate of growth of urban markets in Africa (Cohen, 2004). The urban population in Africa is growing 2.17 times as fast as rural populations (Figure 5). When the African population surpassed one billion in 2008 the ratio of the rural population to urban dwellers was 1.6. Projections suggest that Africa’s population will reach two billion by 2041 with rural and urban populations being roughly equal.
Urban population growth can be helpful to economists and demographers when forecasting the change in food demand, associated food supply chains, and the underlying raw material commodities. In Africa, urban consumers tend to be more time constrained, resulting in greater demand for food away from home and processed foods as well as shifting their diets from starches towards protein and animal sourced foods (Cockx et al, 2019). Such demographic changes present very supportive trends for soybean’s role within a large, fast growing, and more urban food system in Africa.
Note: The Soybean Innovation Lab (SIL) at the University of Illinois is the world’s leading organization focused on establishing soybean as the feed, oil, industrial materials, and biofuels standard in Sub Sharan Africa (SSA). SIL’s strong network across 31 countries, experienced team, track record of success, and partners on the ground support clients looking to serve the fastest growing and a potentially large new soy market.
References
Cohen, B. (2004). Urban Growth in Developing Countries: A Review of Current Trends and a Caution Regarding Existing Forecasts. World development, 32(1), 23-51. https://doi.org/10.1016/j.worlddev.2003.04.008
Cockx, L., Colen, L., De Weerdt, J., & Gomez Y Paloma, S. (2019). Urbanization as a Driver of Changing Food Demand in Africa: Evidence from Rural-Urban Migration in Tanzania. https://publications.jrc.ec.europa.eu/repository/handle/JRC107918
Disclaimer: We request all readers, electronic media and others follow our citation guidelines when re-posting articles from farmdoc daily. Guidelines are available here. The farmdoc daily website falls under University of Illinois copyright and intellectual property rights. For a detailed statement, please see the University of Illinois Copyright Information and Policies here.