


Area Add-Up Insurance Performance: Insights from Cotton STAX
Starting with crops harvested in 2026, premium subsidy for ECO (Enhanced Coverage Option) and SCO (Supplemental Coverage Option) area add-up insurance will be 80% (see Data Note). Coverage options are 90% or 95% for ECO and 90% for SCO. STAX area add-up insurance has offered 90% coverage – 80% subsidy for cotton since 2015. Ratio of indemnities net of farmer paid premiums to farmer paid premiums has been notably higher for STAX than individual farm insurance, especially when insurance price declined double digits. Performance should be similar for ECO and SCO, implying they are options farmers may want to consider for managing downside price risk.
Background: STAX Insurance
Over 2015-2024, farmers bought STAX for 29% of acres insured in individual farm cotton products. STAX can be purchased alone, but 99.5% of its acres have been in its area add-up version. STAX area add-up covers from 90% down to the coverage level a farmer buys for RP (Revenue Protection), RPHPE (Revenue Protection with Harvest Price Exclusion), or YP (Yield Protection) individual farm insurance, with a coverage floor at 70%. RP and RPHPE versions of STAX exist. RP is 99.8% of STAX acres. This article compares performance of STAX-RP with cotton RP and YP individual farm insurance using data from USDA, RMA (US Department of Agriculture, Risk Management Agency) Summary of Business. For more information on STAX, see the USDA, RMA STAX Fact Sheet.
Premium Subsidies
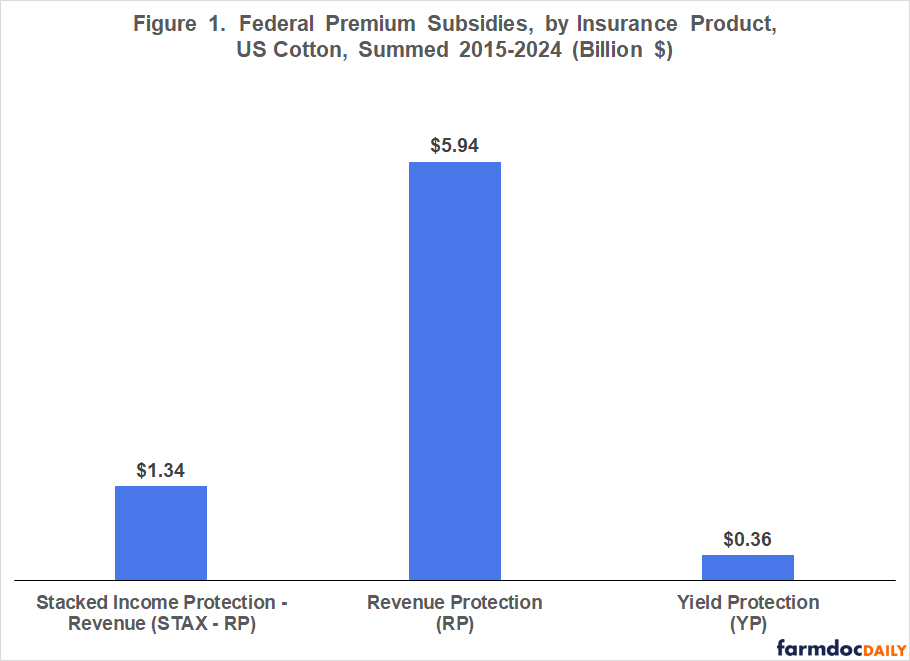
STAX-RP premium subsidies totaled $1.34 billion over 2015-2024, or 18% of premium subsidies for cotton STAX-RP, RP and YP (see Figure 1).
Payment Incident
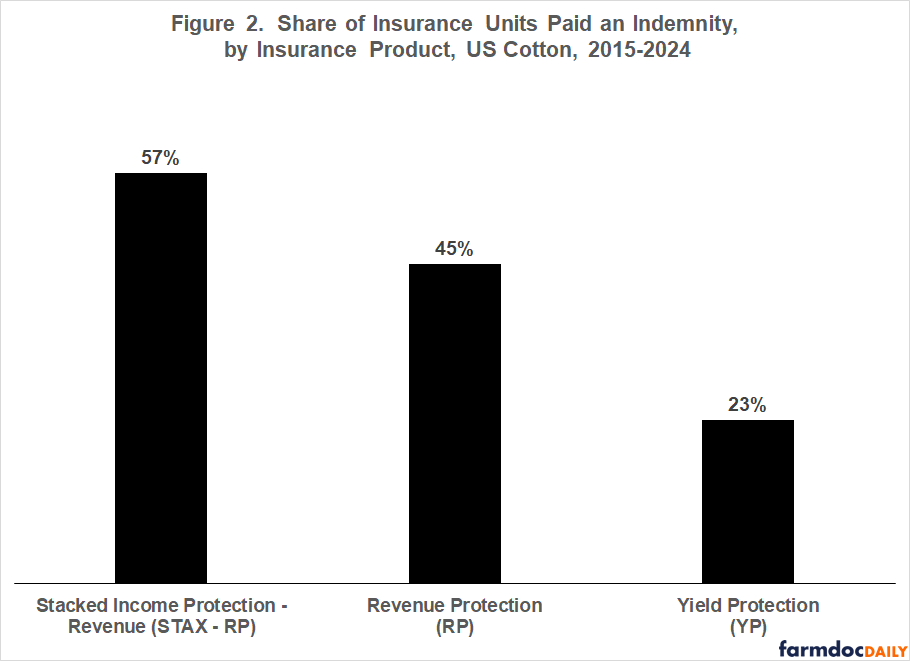
Over 2015-2024, an indemnity was paid, on average, to 57%, 45%, and 23% of units insured with STAX-RP, RP, and YP, respectively (see Figure 2). STAX-RP was expected to have the highest payment incidence since its coverage level is higher. Average coverage level bought for cotton RP and YP products was 69% and 58%. YP was expected to have the lowest payment incidence since it covers only yield declines while revenue products cover price and yield declines. Averages were calculated using each crop year as an individual observation.
Gross Insurance Loss Ratio
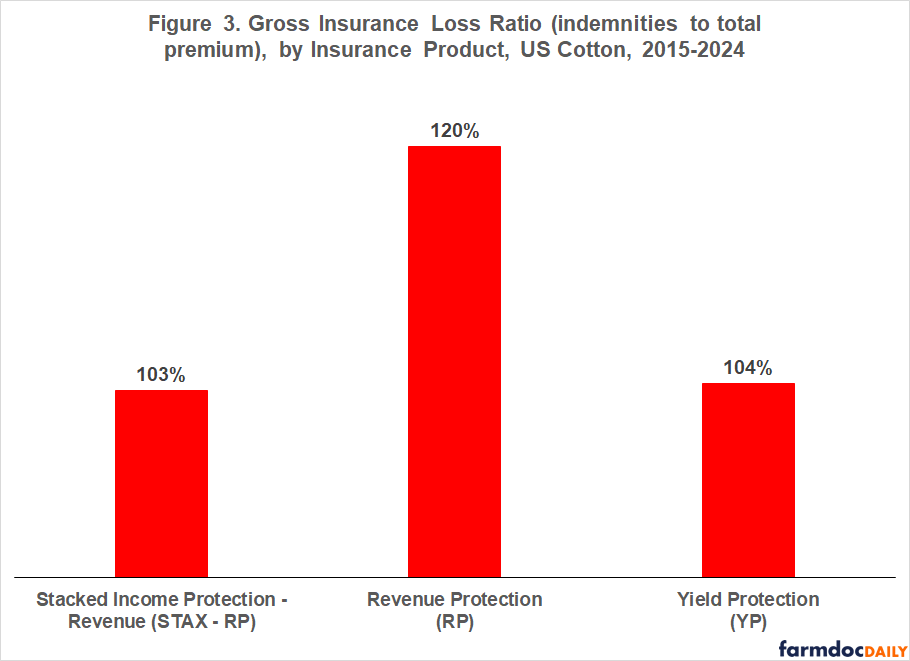
For insurance providers, a key performance metric is the gross insurance loss ratio, i.e. (indemnities paid divided by total premiums). For US crop insurance, total premiums are farmer-paid premiums plus Federal premium subsidies. Over 2015-2024, the average loss ratio was nearly identical for STAX-RP and YP (see Figure 3). RP had a numerically higher average loss ratio, but probably is not dissimilar given only 10 years of observations and large year-to-year variation in indemnity payments.
Indemnities to Farm Paid Premium
For farmers, a key performance measure of publically subsidized insurance is percent profitability, i.e., [(indemnities received net of premiums they paid) divided by (farmer-paid premiums)]. This farmer profit ratio averaged notably higher for STAX-RP than RP and YP over 2015-2024 (see Figure 4). STAX-RP had a higher farmer profit ratio in all years except 2015 vs. YP and 2021 vs. RP.
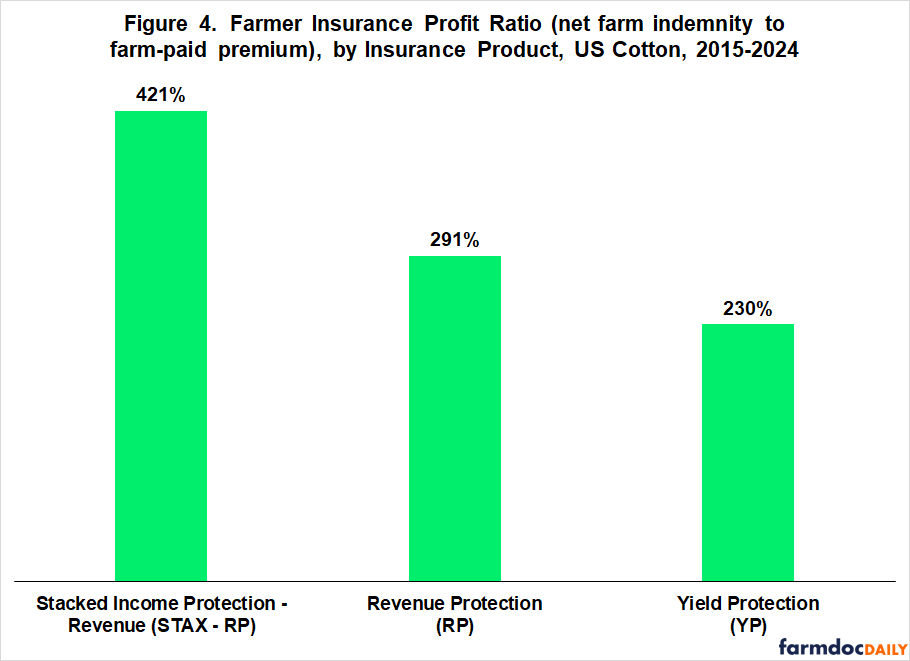
Farmer percent profitability is higher for STAX-RP due to its higher incidence of payment (see Figure 2) and its 80% premium subsidy. Average subsidy rate was 69% for cotton RP and YP products bought over 2015-2024. A higher subsidy rate increases farmer percent profitability by reducing farmer-paid premiums and by increasing net farm indemnities, assuming only the subsidy rate changes.
Role of Price
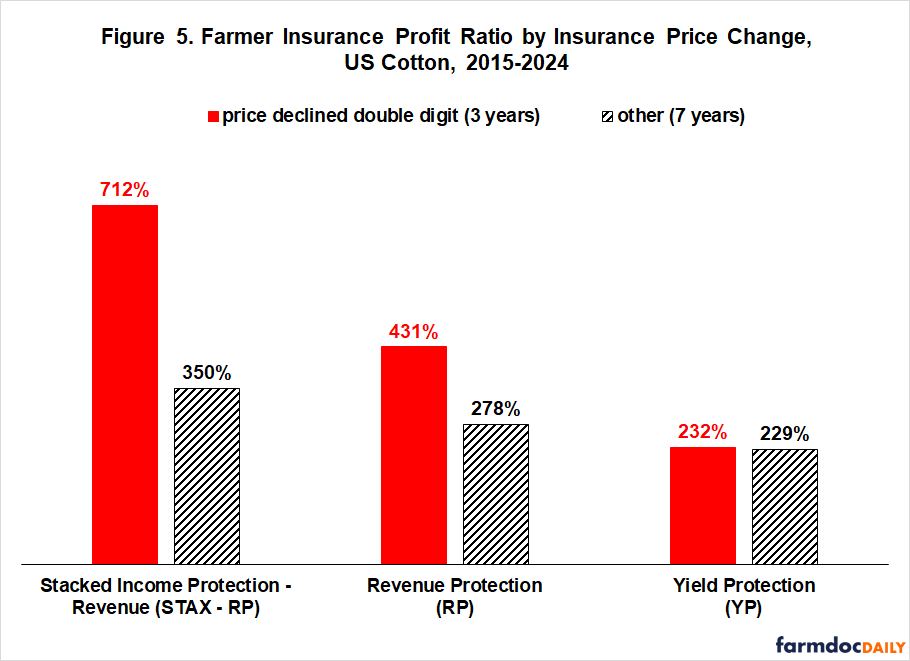
The farmdoc daily of July 21, 2025 presented evidence that area add-up insurance with an 80% premium subsidy and coverage above 85% would likely be a potential option for managing price risk over the growing season. Cotton insurance price declined by more than 10% (STAX-RP’s deductible) in 2019, 2022, and 2024. In these years, farmer profit ratio was notably higher for STAX-RP, averaging 712% (see Figure 5) as it paid 89% of its insurance units. STAX-RP also had the highest average farmer profit ratio in the other seven years, but its advantage was smaller.
Policy Discussion
Starting with crops harvested in 2026, ECO and SCO area add-up insurance will both have an 80% premium subsidy. Coverage options are 90% and 95% for ECO and 90% for SCO.
Since 2015, 90% coverage – 80% subsidy STAX-RP area add-up insurance has been available for cotton. Farmer profit ratio has averaged notably higher for STAX-RP than for RP and YP individual farm insurance, especially when insurance prices declined more than STAX-RP’s 10% deductible.
Assuming actuarially fair crop insurance, performance of STAX-RP should translate in general to SCO and ECO, implying SCO and especially 95% coverage ECO is a potential option to consider for managing downside price risk during the growing season. ECO acres quadruped and its premium subsidies increased by $1 billion for 2025 crops when its subsidy rate was raised to 65% (see farmdoc daily of December 10, 2025). Crop insurance’s role in farm management and the Federal budget will likely expand much more as ECO (and SCO) subsidy rate increases to 80%.
Data Note
Subsidy rate was raised to 80% for SCO by the 2025 One Big Beautiful Bill and for ECO by USDA, RMA administrative action dated August 20, 2025.
References
US Congress (119th). Accessed November 2025. H.R. 1 – One Big Beautiful Bill. CONGRESS.GOV https://www.congress.gov/bill/119th-congress/house-bill/1.
US Department of Agriculture, Risk Management Agency. November 2025. Summary of Business. http://www.rma.usda.gov
US Department of Agriculture, Risk Management Agency. August 20, 2025. MGR-25-006: One Big Beautiful Bill Act Amendment. https://www.rma.usda.gov/policy-procedure/bulletins-memos/managers-bulletin/mgr-25-006-one-big-beautiful-bill-act-amendment
US Department of Agriculture, Risk Management Agency. Revised January 2024. Stacked Income Protection Plan (STAX) for Upland Cotton. Fact Sheet. https://www.rma.usda.gov/sites/default/files/2024-02/STAX-Upland-Cotton-Fact-Sheet.pdf
Zulauf, C. "Crop Insurance, 2025 Farm Bill, and Mission Creep." farmdoc daily (15):132, Department of Agricultural and Consumer Economics, University of Illinois at Urbana-Champaign, July 21, 2025.
Zulauf, C. "Circumventing the Federal Budget Process: Crop Insurance Premium Subsidies." farmdoc daily (15):227, Department of Agricultural and Consumer Economics, University of Illinois at Urbana-Champaign, December 10, 2025.
Disclaimer: We request all readers, electronic media and others follow our citation guidelines when re-posting articles from farmdoc daily. Guidelines are available here. The farmdoc daily website falls under University of Illinois copyright and intellectual property rights. For a detailed statement, please see the University of Illinois Copyright Information and Policies here.