


Common Questions on SCO and ECO
The new higher subsidies for the Supplemental Coverage Option (SCO) and Enhanced Coverage Option (ECO) have generated significant interest among farmers (see farmdoc daily, February 3, 2026). We recently released the Insurance Evaluator to help farmers make decisions concerning the use of SCO and ECO (see farmdoc daily, February 10, 2026). Today’s article addresses three common questions that we have received relative to ECO and SCO.
Should the Fact that County Expected Yields Lag Actual Yields Influence My Decision?
Several have noted that the RMA’s expected yields for some counties lag behind their actual yields. In areas where RMA’s expected yields are too low relative to actual yield expectations, insurance payments will be triggered less frequently and at levels insufficient to offset losses (see farmdoc daily, January 27, 2026). This, then, causes skepticism about using area-based products such as SCO and ECO.
As background, SCO and ECO are county-level products that sit on top of an underlying COMBO product. When RP is the COMBO product, SCO and ECO will have a guarantee that increases if harvest prices exceed projected prices, as does the underlying RP product. Each year, RMA releases expected yields for county-level products. Those yields are used to set guarantees for SCO and ECO. When combined with RP, SCO sets its guarantee based on 86% of expected revenue which equals:
Expected county yield times the higher of projected or harvest price.
Likewise, ECO’s guarantee is based on 90% or 95% of the expected revenue.
The chance of receiving a payment decreases when expected yields lag actual yields. Since its inception in 2015, RMA’s expected yields have lagged actual yields in most Illinois counties. The same is true across the Midwest. Figure 1 shows a history of expected yields for corn and soybeans in DeKalb County, Illinois (Northern Illinois), McLean County (Central Illinois), and Saline County (Southern Illinois). As illustrated, expected yields have been more likely to be below actual yields since SCO’s introduction in 2015. RMA’s procedures do not appear to reflect the pace of yield increases in the Midwest.
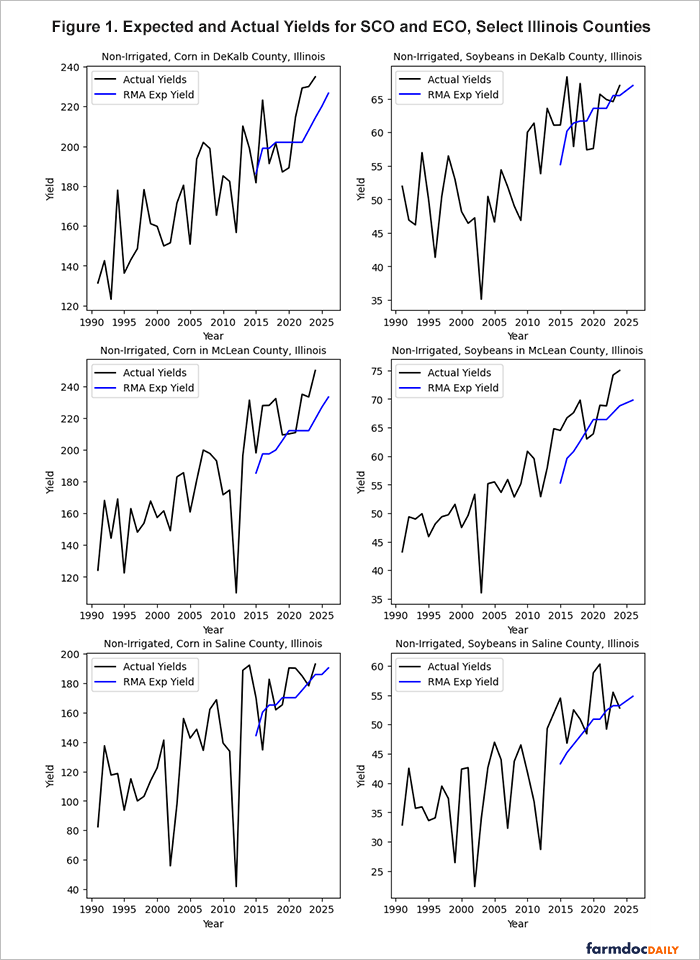
As a result, SCO and ECO will not pay as often nor as much as they should in Illinois and the Midwest. Still, the very high premium subsidies of 80% will likely result in expected payouts from SCO and ECO which exceed the amount of farmer-paid premiums, over time, particularly for ECO at the 95% level.
The Insurance Evaluator incorporates the observed historical relationships from 2015 through 2025 between RMA’s Expected Yields and actual yields by county when reporting results. Thus, the estimated net benefits (expected indemnity payments less farmer-paid premium) account for the fact that actual yields have tended to be higher than what expected yields would suggest.
More detail on the expected yield issue is in two farmdoc daily articles: January 27, 2026 and June 24, 2025.
Why is ECO 95% preferred over ECO-90% and SCO?
We have reviewed many situations in the Insurance Evaluator and analyzed other information. The following general recommendation for adding ECO and SCO to an insurance portfolio is given.
- First, consider ECO-95% coverage. In the vast majority of cases, ECO-95% will perform better than ECO-90%. The 95% guarantee will trigger in many more situations than the 90% guarantee, which when interacting with an 80% subsidy, increases the net payment benefits producers can expect to receive.
- Then consider SCO. SCO will add additional protection, but not as much as that offered by ECO95%. ECO-95% will trigger in many more situations than will SCO.
Another point of view is to analyze the expected return per dollar of farmer-paid premium, based on the 80% subsidy rate, which took effect in 2026 for the first time. Table 1 shows these values for ECO-95%, ECO-90%, and SCO. The SCO product in table 1 covers a range from 86% to 75%, indicating that an RP policy with a 75% coverage level is purchased with SCO. For corn, ECO-95% has an expected return of $1.22 per $1 of farmer-paid premium. This return will be an average over time, with the ECO-95% not making payments in about half the years (i.e., a 0% return in those years). Note that ECO-95% has a higher expected payout ($1.22) than ECO-90% ($1.14) per dollar of farmer-paid premium. From a return standpoint, ECO-95% is preferred over ECO-90%. The SCO product has a $1.02 payout, much lower than the ECO products and close to simply breaking even. Details for individual counties can be obtained in the Insurance Evaluator.
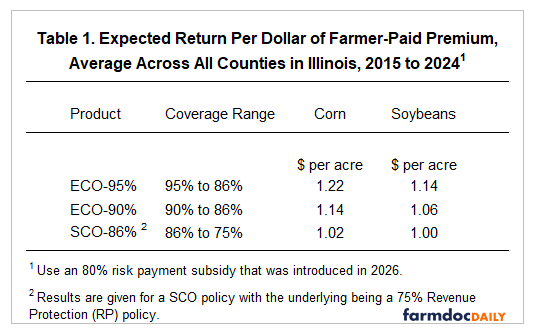
If RMA was achieving its targeted loss ratio of .88, all the expected return values in Table 1 should be $4.40 (see farmdoc daily, February 3, 2026 for a description of loss ratio impact on net farmer benefits). That those values are below $4.40 indicate that RMA is charging too much for SCO and ECO products in Illinois. Those rating issues worsen for lower-coverage-level products. That is, SCO products have more rating problems than ECO-90% and ECO-95%.
Should I avoid SCO and ECO if my Actual Production History (APH) yield is above RMA’s Expected Yield?
SCO and ECO will perform independently from the COMBO product. That is, payment rates are independent from farm APH. The only impact of a farm’s APH will be on the dollar amount of the premium and payment. As an example, take a farm with an APH yield that is 10% higher than the county’s expected yield and compare that to a farm whose APH yield is the same as the county’s expected yield. The county loss and payment rates for SCO or ECO will be the same for both farms. The farm with the higher APH yield will pay a 10% higher premium and receive 10% larger indemnity payments, if they occur, for the SCO and ECO products. In other words, all farms with SCO or ECO coverage within a county will receive a payment, if triggered, regardless of their individual APH. Farms with higher APH yields will receive larger payments and pay higher premiums than farms with lower APH yields.
Farms with higher APH yields, however, tend to receive fewer insurance payments on the COMBO product. If anything, farms with higher APH yields may find ECO and SCO more attractive because of the rating issues associated with the COMBO products.
Summary
Significantly higher subsidy rates which take effect in 2026 mean that producers should seriously consider using the SCO and ECO products. This article addresses three common questions we’ve received about these products. First, while expected county yields used to set guarantees for SCO and ECO may be low relative to actual yield potential in many areas of the Midwest, the high subsidy rates still suggest producers should expect to receive more in payments over time than they pay in premiums. Second, we recommend prioritizing ECO 95% and then considering SCO if additional coverage is desired. Finally, while APH yields on individual farms can differ from the expected yields used for SCO and ECO, this does not impact the likelihood of an individual farm receiving payments. All farms with SCO or ECO coverage in a particular county will receive payments if the coverage is triggered. The size of those payments and the premiums that are paid simply scale proportionally to the farm’s APH relative to the county’s expected yield.
References
Monaco, H., G. Schnitkey, N. Paulson, J. Coppess, B. Sherrick, C. Zulauf, C. Navarro, P. Shan and L. Fu. "Release of Insurance Evaluator with the New SCO and ECO." farmdoc daily (16):21, Department of Agricultural and Consumer Economics, University of Illinois at Urbana-Champaign, February 10, 2026.
Schnitkey, G., H. Monaco, N. Paulson, C. Zulauf and B. Sherrick. "Expected Yields for SCO and ECO in Illinois." farmdoc daily (16):12, Department of Agricultural and Consumer Economics, University of Illinois at Urbana-Champaign, January 27, 2026.
Schnitkey, G., N. Paulson, C. Zulauf, J. Coppess and B. Sherrick. "Dramatic Difference in Expected Yields between Corn, Soybeans, and Cotton for Area-Based Insurance Products." farmdoc daily (15):115, Department of Agricultural and Consumer Economics, University of Illinois at Urbana-Champaign, June 24, 2025.
Schnitkey, G., N. Paulson, C. Zulauf, H. Monaco and B. Sherrick. "SCO and ECO Choices in 2026." farmdoc daily (16):16, Department of Agricultural and Consumer Economics, University of Illinois at Urbana-Champaign, February 3, 2026.
Disclaimer: We request all readers, electronic media and others follow our citation guidelines when re-posting articles from farmdoc daily. Guidelines are available here. The farmdoc daily website falls under University of Illinois copyright and intellectual property rights. For a detailed statement, please see the University of Illinois Copyright Information and Policies here.