


Has the US Crop Safety Net Become Excessive?
The US crop safety net is approaching its centennial. It has been a remarkably adaptive, evolutionary policy. But, 21st Century assistance is raising the question of excessive levels for barley, corn, cotton, oats, peanuts, rice, sorghum, soybeans, and wheat, the crops that USDA, ERS (US Department of Agriculture, Economic Research Service) computes an economic cost of production (COP). Since 2000, annual market net return on average fell 4.2% / year below economic cost of production for these nine crops, but safety net payments averaged 12.7% / year of costs, more than triple the level needed to cover losses.
Overview of Data and Procedures
Market return in this analysis is net of the economic cost of production, including opportunity cost for unpaid family labor and owned land. They are calculated at harvest. The crop safety net is commodity, crop insurance, and ad hoc & emergency programs. Insurance payment is net of farmer-paid premium. Data Notes 1 and 2 contain a detailed discussion of the data and calculations.
Market Returns Since 1975
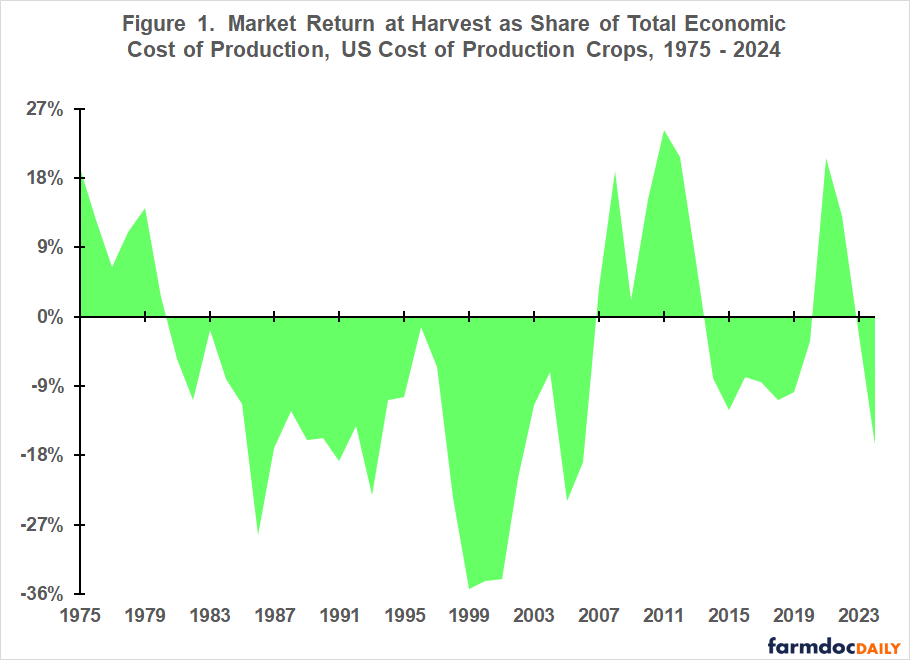
Figure 1 reveals clear persistence in market net return at harvest for the COP crops as a group. If last year’s market net return was positive (negative), this year’s market net return is likely positive (negative). Thus, multiyear periods of positive and negative returns exist. We examine the relationship between market net return and crop safety net payment during these periods in sequential order from earliest to latest. The periods are: 1975-1980 (positive return), 1981-2006 (negative return), 2007-2013 (positive return), 2014-2020 (negative return), 2021-2022 (positive return), and 2023-2024 (negative return).
Crop Safety Net Payment since 1975
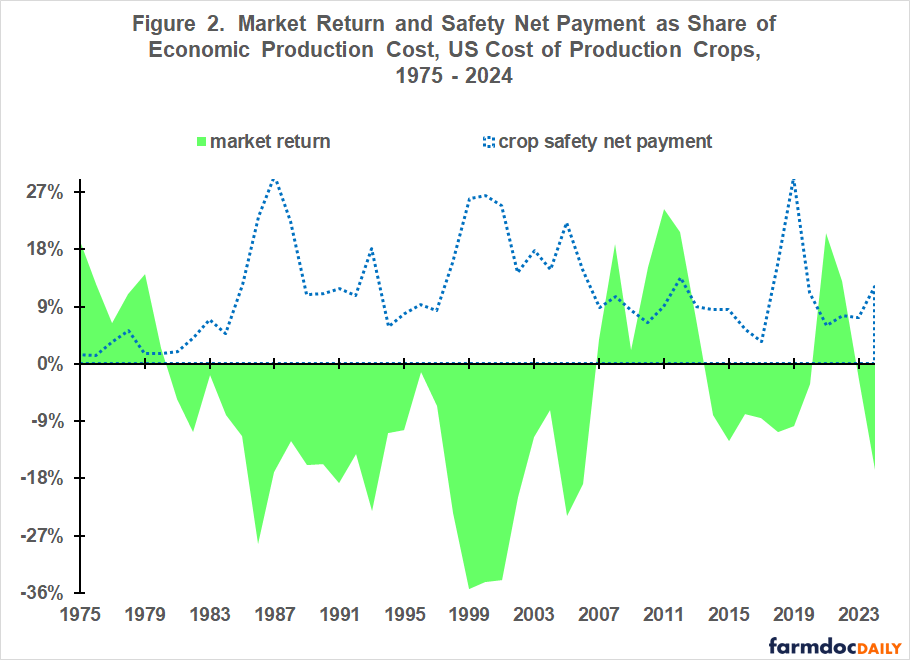
A long-term perspective on crop safety net payment is useful before proceeding to the period analysis (see Figure 2). Safety net payment was countercyclical to market net return prior to 2007. Their correlation was negative 0.82. Since 2007, correlation is negative 0.24, implying the safety net is largely not countercyclical. For a more in-depth discussion of this change in the US crop safety net, see the farmdoc daily of April 11, 2025.
Period Analysis
During 1975-1980, market net return at harvest as a share of total economic cost of production averaged 11.0% / year (see Figure 3). Average return per year was higher during the other two crop prosperity periods: 13.2% for 2007-2013 and 16.8% for 2021-2022. During these two periods, crop safety net payment averaged a notable 9.4% / year and 6.8% / year, respectively.
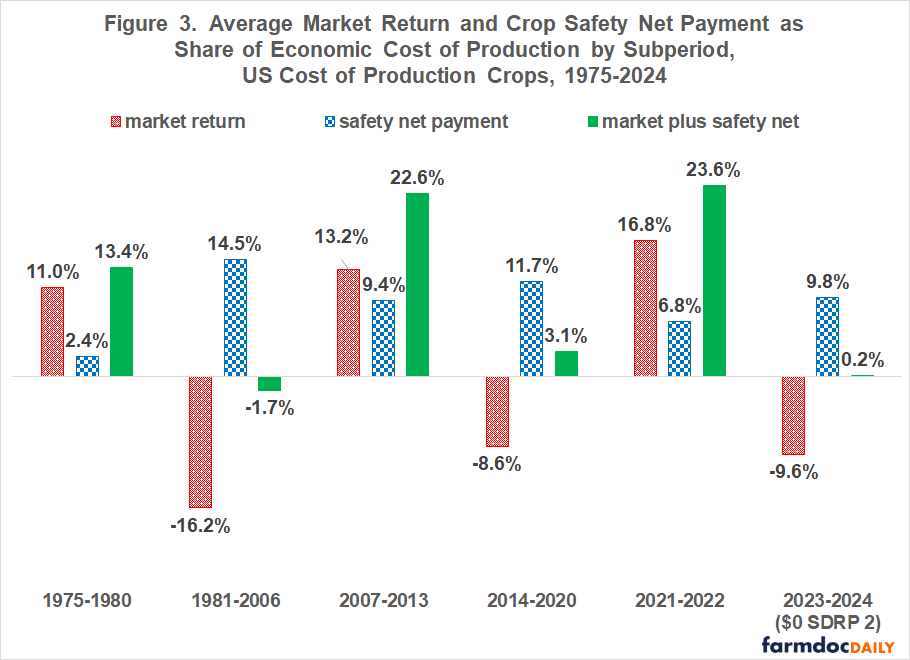
Market net return was negative in every year during the other three periods in Figure 3. They averaged negative 16.2% / year in 1981-2006 vs. roughly negative 9% / year in 2014-2020 and 2023-2024. The crop safety net offset most market loss in 1981-2006. Total return averaged negative 1.7% / year. Market loss has been more than offset in the other two periods. In 2014-2020, total return averaged 3.1% / year. Total return of 0.2% for 2023-2024 contains no SDRP 2 (Supplemental Disaster Relief Program – phase 2) payment. USDA has not yet released actual payment data. If SDRP 2 payment is assumed equal to SDRP 1 payment for the COP crops ($5.2 billion), 2023-2024 crop safety net payment and total net return per year will average 11.2% and 1.6% compared with 9.8% and 0.2% in Figure 2. The assumption implies the COP crops have roughly a 55% share of the $10 billion potential SDRP 2 payment. Their SDRP 1 payment share was 87%.
Policy Implications
No business likes losses, but losses are important to incentivize efficiency in a market economy at the individual firm level and at the collective sector level. So far in the 21st Century, the US crop safety net policy has more than eliminated crop sector loss.
Crop safety net payment more than offset sector loss during the multiple year loss periods of 2014-2020 and 2023-2024. This stands in contrast to the average negative 2% COP crop loss that crop safety net policy revealed was acceptable during the 1981-2006 period of 26 consecutive years of annual market loss.
Moreover, safety net payment was large during the 21st Century crop prosperity periods of 2007-2013 and 2021-2022. The 2014 Farm Bill terminated the fixed per base acre payment program largely responsible for safety net payment during 2007-2013, but ad hoc assistance kept safety net payment high during 2021-2022. Adding government payment to double digit market return is a recipe for excesses, especially when the safety net is more than covering loss when market return is negative. A treadmill of ever higher support seems inevitable as safety net payments above loss find their way into input and land prices.
Debate is badly needed on when and how to curtail, even eliminate, crop safety net payment when market return is positive. This includes crop insurance subsidies. One option is a sliding scale of insurance premium subsidies and share of commodity program payment acres tied to market net return.
Debate is also badly needed on what level of average sector loss overall is consistent with a safety net that does not impede needed market adjustments. The provision of additional ad hoc assistance for the 2025 crops is a critical test of whether the US and US crop agriculture are willing to allow crop sector loss to exist even for a year, consistent with being a competitive enterprise.
Last, recent ad hoc assistance has occurred shortly after harvest, suggesting this is when the policy community believes payment should occur. In contrast, commodity program payment is not made until October of the next calendar year. Payment may thus occur when market return is higher, even positive, exacerbating rather than ameliorating crop economics. Moving commodity program payment to harvest can be easily accomplished by using cash price at harvest rather than market year average price. Crop insurance payment, including from area insurance, needs to be made no later than January to better align assistance with need. Making these changes will also improve the information about other safety net program payments when determining ad hoc assistance.
Data Notes
1. Crop Safety Net Payments (For in-depth discussion of the data and calculations used for this article, see Zulauf, Langemeier, and Schnitkey (2022)).
The crop safety net is composed of commodity, crop insurance, and ad hoc & emergency programs. Commodity programs since 1975 are: Average Crop Revenue Election (ACRE), Agriculture Risk Coverage (ARC), certificate exchange, cotton, cotton ginning, cotton transition, countercyclical (CCP), direct (DP), feed grain, loan deficiency, marketing loan, Price Loss Coverage (PLC), Production Flexibility Contract (PFC), rice, and wheat. Most payment data for these programs are from USDA, ERS Farm Income and Wealth dataset. Exceptions are 1985-1994 loan deficiency and marketing loan payments, which are from USDA, FSA (Farm Service Agency). ACRE, ARC, and PLC payment is assigned to the crop year, not calendar year of payment.
Crop insurance payment is indemnity paid to US farms minus premium paid by US farms. It is calculated using data from USDA, RMA (Risk Management Agency) Summary of Business. All insurance products for a COP crop are included in this calculation.
Payments by the ad hoc Market Facilitation, market loss, oilseed programs, Emergency Commodity Assistance Program, and Supplemental Disaster Relief Program – phase 1 are from USDA, FSA. They are available by crop and crop year. All other ad hoc & emergency payments from 2002 through 2024, including COVID-19 related payments, are from USDA, ERS Farm Income and Wealth dataset. They are available only for all US farms by calendar year and are assigned to the COP crops using their combined share of total US farm cash receipts for a year. The share varies from 22% to 37%.
FSA and RMA data are reported by crop year. Farm Income and Wealth data are reported by calendar year. Use of multiple-year periods should minimize the impact of this reporting difference.
2. USDA, ERS Economic Cost Data (For in-depth discussion of the cost of production data, see “Documentation: USDA Cost of Production Data.”)
USDA, ERS calculates an economic cost per acre planted to barley, corn, cotton, oats, peanuts, rice, sorghum, soybeans, and wheat. A cost is assigned to all inputs except management needed to plant, harvest, and put the crop in condition for storage. Unpaid labor and farmer-owned land are assigned an opportunity cost. Quantity of input is based on periodic surveys of farmers. Input price is updated annually using USDA, NASS (National Agricultural Statistics Service) data.
USDA, ERS also calculates gross and net return to production per planted acre. Gross return includes income from a crop’s primarily product, such as grain and cotton lint, and secondary product(s), such as straw and cottonseed. Price of the product is for the crop’s harvest period. Gross return does not include crop safety payment and storage return. Cost does not include crop insurance premium and storage cost. USDA, ERS thus calculates a market net return at harvest to economic cost of production per planted acre.
For each crop year from 1975 through 2023, net return and economic cost per planted acre for a crop and year are multiplied by acres planted to the crop in that year to generate total US net return and total US economic cost for the crop in the year. Total net return and economic cost for the COP crops for a year are summed to calculate an aggregate net return and economic cost for the nine crops as a group for the year. Planted acres are from USDA, NASS QuickStats.
References and Data Sources
US Department of Agriculture, Economic Research Service. January 2026. Cost of Production. https://www.ers.usda.gov/data-products/commodity-costs-and-returns/
US Department of Agriculture, Economic Research Service. January 2026. Documentation: USDA Cost of Production Data. https://www.ers.U.S.da.gov/data-products/commodity-costs-and-returns/documentation/
US Department of Agriculture, Economic Research Service. January 2026. Farm Income and Wealth Statistics. https://www.ers.usda.gov/data-products/farm-income-and-wealth-statistics/
US Department of Agriculture, Farm Service Agency. January 2026. ARC-PLC Program Data https://www.fsa.usda.gov/resources/programs/arc-plc/program-data
US Department of Agriculture, Farm Service Agency. January 2026. Emergency Commodity Assistance Program (ECAP). https://www.fsa.usda.gov/resources/programs/emergency-commodity-assistance-program
US Department of Agriculture, Farm Service Agency. January 2026. Supplemental Disaster Relief Program (SDRP). https://www.fsa.usda.gov/resources/programs/supplemental-disaster-relief-program-sdrp
US Department of Agriculture, Farmers.gov. July 13, 2020. Market Facilitation Program: Payment Report. https://www.farmers.gov/manage/mfp.
US Department of Agriculture, National Agricultural Statistics Service. January 2026. QuickStats. http://quickstats.nass.U.S.da.gov/
US Department of Agriculture, Risk Management Agency. January 2026. Summary of Business. http://www.rma.U.S.da.gov/
Zulauf, C. and D. Orden. 2026. US Farm Bill in 2025: Ad Hoc Assistance becomes an Expanded Multi-Year Safety Net. Forthcoming in EuroChoices.
Zulauf, C., J. Coppess, G. Schnitkey and N. Paulson. “Demise of the US Countercyclical Crop Safety Net.” farmdoc daily (15):68, Department of Agricultural and Consumer Economics, University of Illinois at Urbana-Champaign, April 11, 2025.
Zulauf, C. M. Langemeier, and G. Schnitkey. 2022. U.S. Crop Profitability and Farm Safety Net Payments since 1975. Journal of the American Society of Farm Managers and Rural Appraisers. Pages 60-69. https://www.asfmra.org/resources/asfmra-journal/2022journal
Disclaimer: We request all readers, electronic media and others follow our citation guidelines when re-posting articles from farmdoc daily. Guidelines are available here. The farmdoc daily website falls under University of Illinois copyright and intellectual property rights. For a detailed statement, please see the University of Illinois Copyright Information and Policies here.