


Historical Cropping Patterns for Illinois Grain Farms
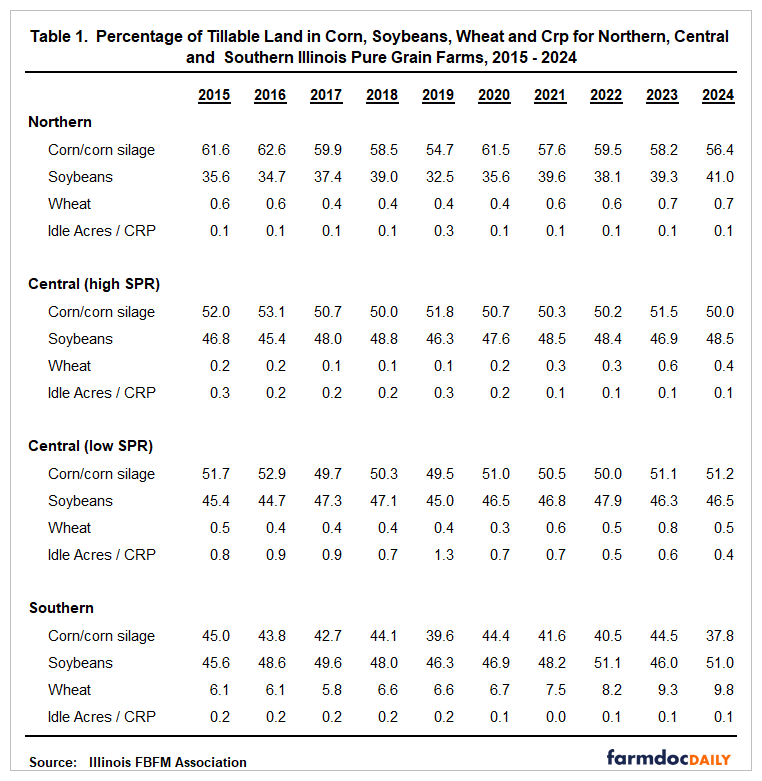
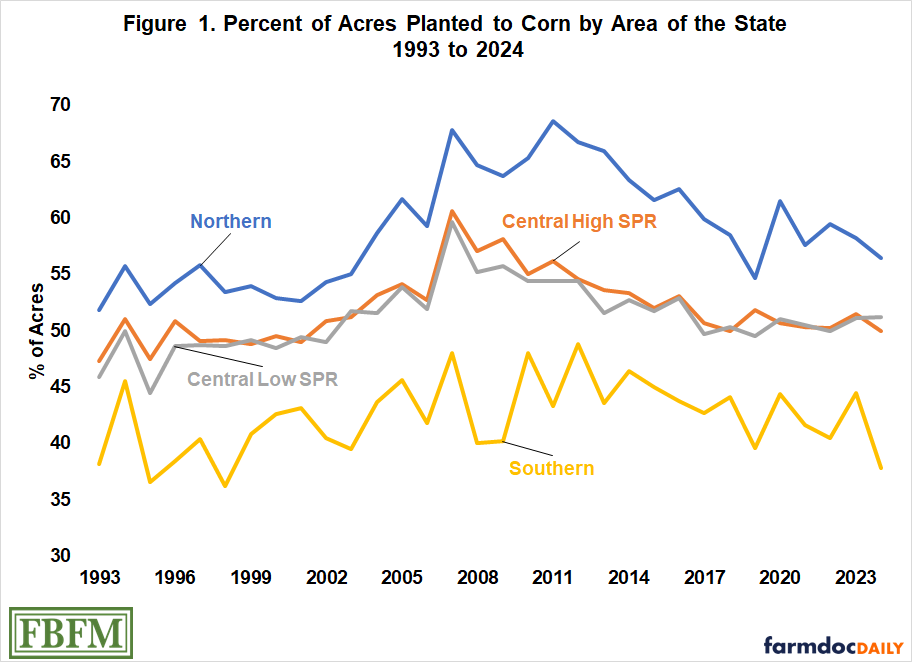
This article examines historic cropping patterns for northern, central and southern Illinois pure grain farms from 2015 through 2024 (Table 1) and the percentage of acres planted to corn by region from 1993 to 2024 (Figure 1). Farms in the study are enrolled in the Illinois Farm Business Farm Management (FBFM) Association. Farms in northern Illinois are generally located north of Interstate 80. Farms in southern Illinois are generally located south of Interstate 70. Central Illinois farms are located between the two Interstates. Farms in central Illinois are further divided between higher and lower soil productivity (SPR) levels. Financial, agronomic, weather, economic factors and the relative price of corn and soybeans will be taken into consideration by producers when adjustments are made in their cropping rotations.
Northern Illinois
Northern Illinois farms historically have had the highest percentage of land in corn than any other area in the state. During the 2015 through 2024 time period, at least 54.7 percent of the tillable land on these farms each year has been in corn. The highest was 62.6 percent in 2016 and the lowest was 54.7 percent in 2019. These farms have been trending towards a corn/soybean rotation with soybean acres slowly increasing and corn acres decreasing. Since 2022, the percentage of corn acreage has begun to decrease while the percent of soybean acres has been increasing. Less than 1 percent of the tillable land on these farms in any year has been planted with wheat. The percentage of tillable land in Conservation Reserve Program (CRP) or idle acres was highest in 2019 due to wet weather conditions leading to acres being left idle due to prevent planting claims. The thirty-two year trend for tillable acres planted to corn increased until the 2007 to 2011 time frame and then decreased until 2019, increased for 2020 to 2022 during periods of higher prices and has been decreasing since 2022 due to higher input costs and lower prices (Figure 1).
Central Illinois
During the last ten years, farms in central Illinois have shown a gradual decrease in corn acres in their crop rotation, except for 2023 when it increased slightly. These farms have been the closest to a 50/50 corn/soybean rotation as compared to the other areas in the state. Farms in central Illinois with the higher soil ratings have varied from 50.0 percent of their land in corn in 2018 and 2024 to 53.1 percent in 2016. Soybean acreage has varied from 46.3 percent in 2019 to 48.8 percent in 2018. Unlike farms in northern Illinois, these farms had an increase in corn acreage from 2022 to 2023. These farms had less than one percent total acreage in wheat and idle / CRP acres. In Figure 1, the percentage of corn acres increased slightly until about 2006; jumped to the highest percent of 60.6 percent in 2007; and then decreased back to around 50 percent.
Farms in central Illinois with the lower-productivity soils were similar in terms of cropping patterns to those in central Illinois with the higher productivity soils. Generally, they planted between 49.5 and 52.9 percent of their land in corn and between 44.7 and 47.9 percent of their land in soybeans. Although these farms had slightly more wheat acreage than the other central Illinois farms, it still was insignificant. Like in northern Illinois, there was an uptick in idle / CRP acres in 2019 due to the wet spring. The overall trend in Figure 1 is like that of central Illinois with higher quality for the percent of acres planted to corn.
Southern Illinois
Crop rotations in southern Illinois have historically varied from those in central and northern Illinois primarily due to differences in soil types and climate. Soils in this region are subject to significant yield variability during adverse weather conditions. Partly because of this factor, southern Illinois has tended to raise more wheat and soybeans relative to corn. Wheat and soybeans tend to perform better in unfavorable weather conditions. Producers can also take advantage of double cropping soybeans after the wheat is harvested. Over the last ten years, there have been fluctuations between higher and lower wheat acreage to now higher percentages of wheat in the last couple of years. The percentage of land planted to corn has varied from 37.8 percent in 2024 to 45.0 percent in 2015. Acreage planted to soybeans has ranged between 45.6 percent in 2015 and 51.1 percent in 2022. There have not been any years in the last ten years that there was a larger percentage of corn acres than soybean acres. Acres planted to wheat have varied from 5.8 percent in 2017 to 9.8 percent in 2024. There is more fluctuation in cropping patterns in southern Illinois compared to other regions of the state due to lighter soils and the soils’ greater sensitivity to weather conditions. In Figure 1, the percentage of corn acres varies each year with no substantial trend either way; however, on average it is between 35 and 49 percent over the last 30 years.
Summary
Over the last ten years, when we look at the costs of producing corn versus soybeans, it has been more profitable economically to produce soybeans than corn, except for 2021 and 2022. This explains the general downward trend in the percentage of corn acres in crop rotations in Illinois. Over the last 30 years, we have seen a shift to more corn acres until the 2007 to 2012 time period (when we saw an increase in the demand for corn) and since that period, the percentage of acres in the crop rotation planted to corn has decreased until about 2020. For 2024, the downward shift continued in all regions of the state except central Illinois with the lower quality soils, which remained stable. More detailed enterprise records and analysis will help guide economic and financial decisions; however, other agronomic reasons and weather issues play a large role in the impact of crop rotations as well.
The author would like to acknowledge that data used in this study comes from Illinois Farm Business Farm Management (FBFM) Associations across the state. Without their cooperation, information as comprehensive and accurate as this would not be available for educational purposes. FBFM, which consists of 5,000 plus farmers and 65 plus professional field staff, is a not-for-profit organization available to all farm operators in Illinois. FBFM field staff provide on-farm counsel with recordkeeping, farm financial management, business entity planning and income tax management. For more information, please contact the State FBFM Office located at the University of Illinois Department of Agricultural and Consumer Economics at 217-333-8346 or visit the FBFM website at www.fbfm.org.
Disclaimer: We request all readers, electronic media and others follow our citation guidelines when re-posting articles from farmdoc daily. Guidelines are available here. The farmdoc daily website falls under University of Illinois copyright and intellectual property rights. For a detailed statement, please see the University of Illinois Copyright Information and Policies here.