


Ethanol Production Profits in 2025
The U.S. ethanol industry entered 2025 coming off five consecutive years of positive profits. With all of the headwinds facing the industry due to trade policy and economic uncertainty, it was not a sure thing that the streak would continue. The purpose of this article is to estimate the profitability of U.S. ethanol production for the 2025 calendar year and assess whether the industry continued its impressive run of profitability.
Ethanol Plant Model
A model of a representative Iowa ethanol plant is used to track the profitability of ethanol production. It is the same basic model of a representative ethanol plant that has been used in previous farmdoc daily articles on the subject (e.g., March 22, 2023; February 12, 2024; March 5, 2025). The original version of the model was developed by Don Hofstrand of Iowa State University and was meant to be representative of a typical ethanol plant constructed in the mid-2000s. There is certainly substantial variation in capacity and production efficiency across the industry and this should be kept in mind when viewing profit estimates based on the model.
Some of the original assumptions of the model have been changed based on additional analysis or changing data availability. Current model assumptions include:
- Dry mill plant constructed in 2007
- 100 million gallon annual ethanol production capacity
- Plant construction costs of $2.11 per gallon of ethanol production capacity
- 40% debt and 60% equity financing
- 8.25% interest on 10-year loan for debt financing, with the loan fully repaid in 2017
- A total of $0.21 fixed costs per gallon of ethanol produced through 2017 and $0.15 per gallon in 2018-2024 (the decline is due to the loan payoff)
- Non-corn, non-natural gas variable costs (including denaturant) of $0.21-$0.26 per gallon in 2007-2011
- Non-corn, non-natural gas variable costs (excluding denaturant) of $0.17 -$0.22 per gallon after 2011
- Variable denaturant costs after 2011 computed as 2 percent of the wholesale CBOB price
- 82.5 cubic feet of natural gas per bushel of corn processed
- Netback (marketing) costs of $0.05 – $0.08 per gallon of ethanol and $4-$6 per ton of DDGS
- Extraction and marketing costs of $0.05 – $0.07 per pound of corn oil
- All costs after 2011 are indexed to inflation using the Consumer Price Index (CPI)
Operating efficiency assumptions represent a key component of the model. These have been revised substantially over time as new data has become available. The latest assumptions are based on analysis of the operating efficiency of the U.S. ethanol industry in a recent farmdoc daily article (February 18, 2026). Specifically, the assumptions for physical conversion rates are as follows:
- 2.75 gallons of ethanol (including denaturant) produced per bushel of corn processed over 2007-2011; 2.80 gallons of ethanol per bushel of corn over 2012-2014; 2.85 gallons of ethanol per bushel of corn over 2015-2018; 2.90 gallons of ethanol per bushel of corn over 2019-2022; and 2.95 of ethanol per bushel of corn in 2023-2025
- 17.75 pounds of DDGS produced per bushel of corn processed over 2007-2011; 17.00 pounds of DDGS per bushel of corn for 2012-2016; 16.50 pounds of DDGS per bushel of corn over 2017-2018; 16.00 pounds of DDGS per bushel of corn in 2019; 15.75 pounds of DDGS per bushel in 2020-2021; 16.00 pounds of DDGS per bushel in 2022; 15.50 pounds per bushel in 2023; and 15.25 pounds per bushel in 2024-2025.
- 0.55 pounds of corn oil per bushel of corn processed over 2012-2014 (start extracting January 2012); 0.60 pounds of corn oil per bushel of corn processed in 2015; 0.70 pounds of corn oil per bushel of corn processed in 2016; 0.75 pounds of corn oil per bushel of corn processed in 2017-2019; 0.80 pounds of corn oil per bushel of corn processed in 2020; 0.85 pounds of corn oil per bushel of corn processed in 2021; 0.90 pounds of corn oil per bushel of corn processed in 2022-2024, and 0.95 pounds of corn oil per bushel of corn processed in 2025.
- 0.10 gallons of cellulosic ethanol (including denaturant) produced per bushel of corn starting in 2025. This assumption for cellulosic conversion efficiency is consistent with previous scientific research (Kurambhatti et al., 2018) and the increase in the aggregate U.S. ethanol conversion rate for 2025 documented in this previous farmdoc daily article (February 18, 2026). The recent expansion of cellulosic ethanol production was jumpstarted by new U.S. Environmental Protection Agency (EPA) guidelines for documenting co-production of cellulosic ethanol with corn starch ethanol in March 2024. There are several possible technologies for co-production of cellulosic ethanol, with corn kernel fiber (CKF) technology almost certainly the leader. CKF technology uses specialized enzymes in the fermentation process to convert the fibrous part of the corn kernel into sugars that can be fermented into ethanol. An advantage of CKF technology is that it does not require new investment in additional physical equipment, such as tankage, because the fermentation of the corn fiber occurs in the same tank used for production of non-cellulosic ethanol. The adoption of CKF technology is driven by relatively high prices for D3 cellulosic RINs, which averaged $2.34 per gallon in 2025. At the assumed 0.1 conversion rate, this implies that cellulosic ethanol production generated an additional $0.234 per gallon of revenue from the sale of D3 RINs. This is on top of the additional revenue from selling cellulosic ethanol into the regular fuel ethanol market. The main additional cost of CKF production is the specialized enzymes that are required. There is limited information on the price of these enzymes in the public domain. Lacking any better information, we assume enzyme and marketing costs to be $0.20 per gallon.
- Given the above assumptions, the total ethanol yield for the representative plant in 2025 is 3.05 gallons per bushel of corn processed.
To track plant profitability over time, weekly corn, ethanol, and DDGS prices at Iowa ethanol plants are collected from the USDA Agricultural Marketing Service starting in late January 2007. Crude corn oil prices for the Midwest are available from OPIS. Natural gas costs over 2007 through March 2014 are based on monthly industrial prices for Iowa available from the EIA. Due to a change in the behavior of the industrial price series, starting in April 2014 natural gas costs are based on monthly electric power consumer prices for Iowa, also from the EIA. D3 RIN prices are collected from OPIS.
Analysis
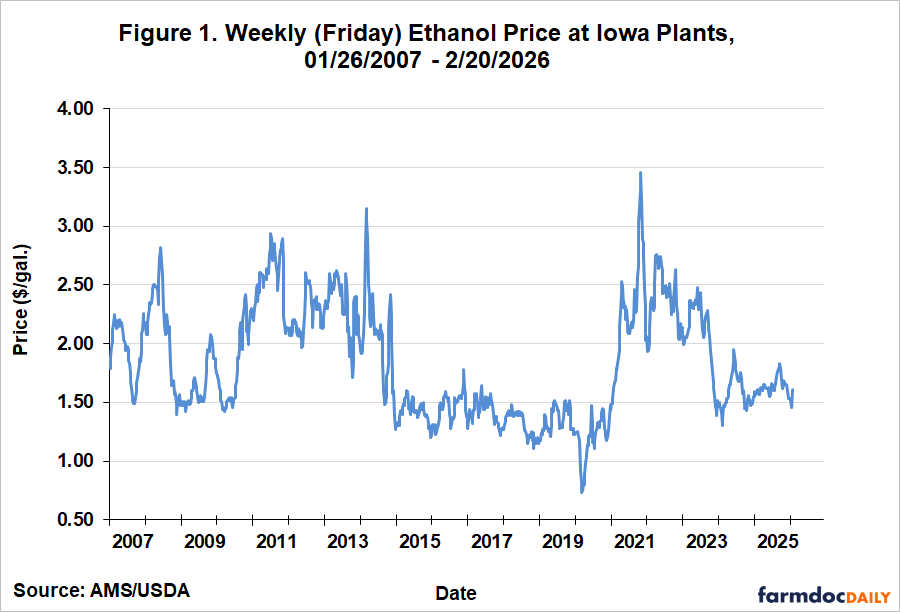
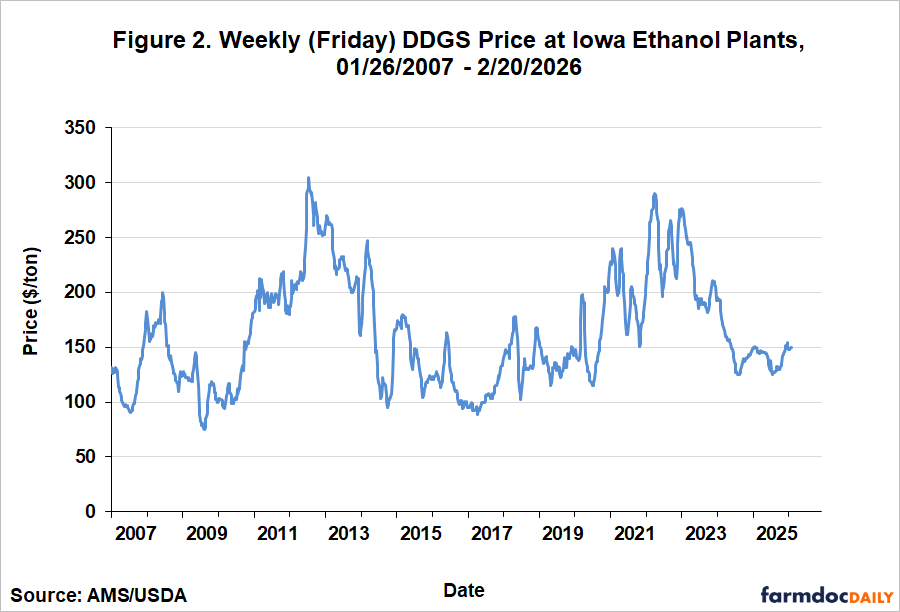
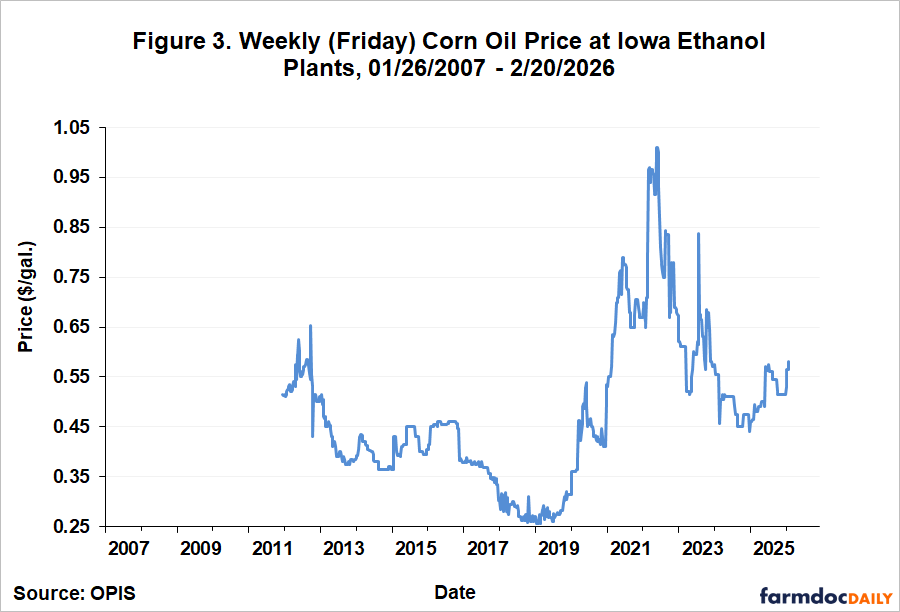
Figures 1, 2, and 3 present the three main components of ethanol production revenue on a weekly basis from January 26, 2007 through February 20, 2026. Figure 1 shows the weekly price of ethanol at Iowa plants. The figure reveals that prices in 2025 traded most of the year in a relatively narrow range between about $1.50 and $1.70 per gallon. The peak ethanol price of $1.83 occurred in October. Figure 2 shows that weekly DDGS prices also moved in a narrow range in 2025 between roughly $125 and $150 per ton. Figure 3 shows that weekly corn oil prices during 2025 started the year at $0.44 per pound, rose sharply to a peak of $0.56 in August, and then fell back to $0.52 by the end of the year. Overall, the pattern of output prices for ethanol producers in 2025 can best be described as “rangebound.”
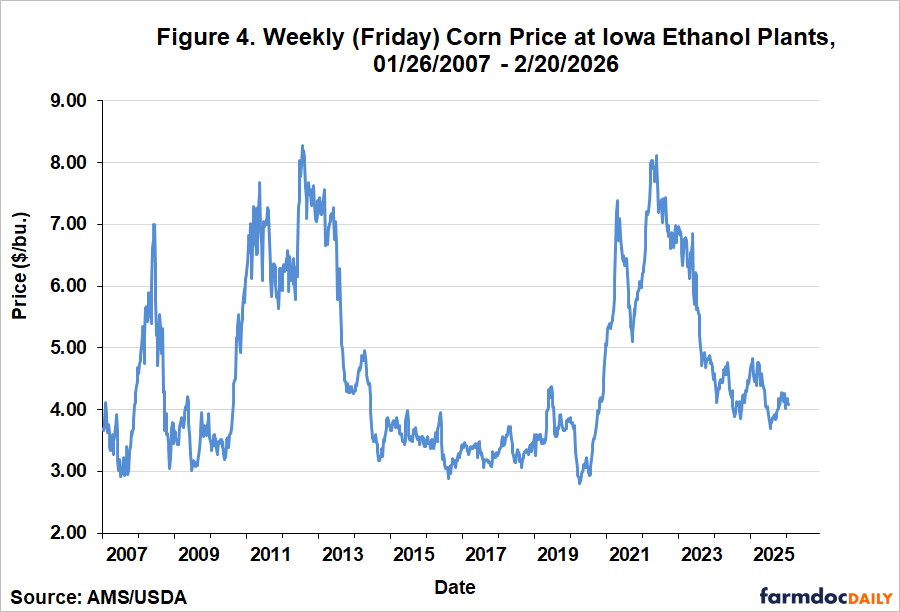
The main input cost of producing ethanol is corn (about 80 percent). Figure 4 shows that the price of corn moved in a fairly wide range in 2025, from lows below $4.00 per bushel to highs nearly reaching $5.00.
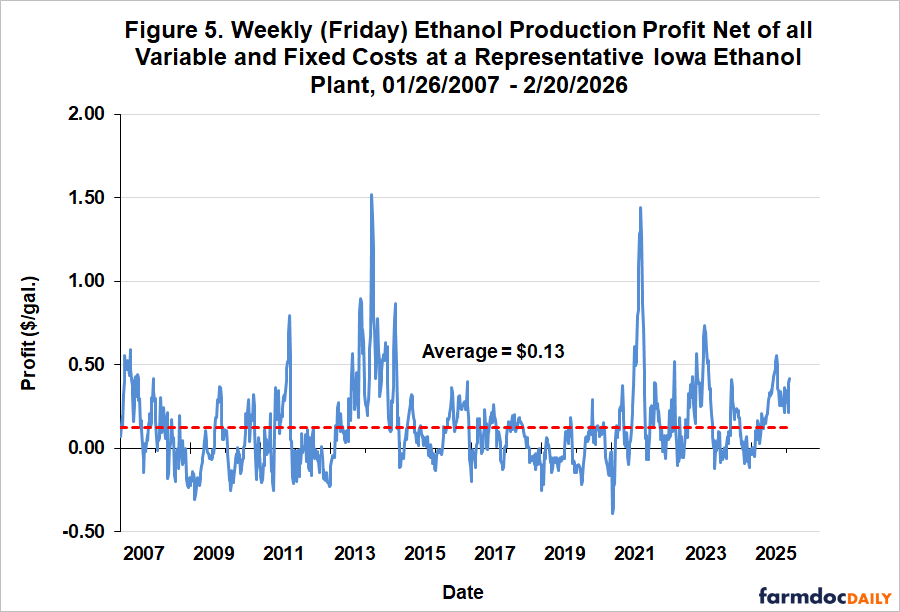
Weekly ethanol production profit net of all variable and fixed costs is shown in Figure 5. Net profits ranged widely in 2025, from a low of -$0.05 to a high of $0.56 per gallon. Overall, there was a sharp uptrend in profits throughout the year, with the peak of $0.56 being reached in October. Net profits for 2025 averaged $0.21 per gallon, well above the historical average of $0.13 since 2007. It is important to recognize the role that cellulosic ethanol played in boosting profits in 2025. Net returns for cellulosic ethanol averaged $0.06 per gallon. Without this additional profit, net returns for the plant would have been much closer to the long-run average of $0.13.
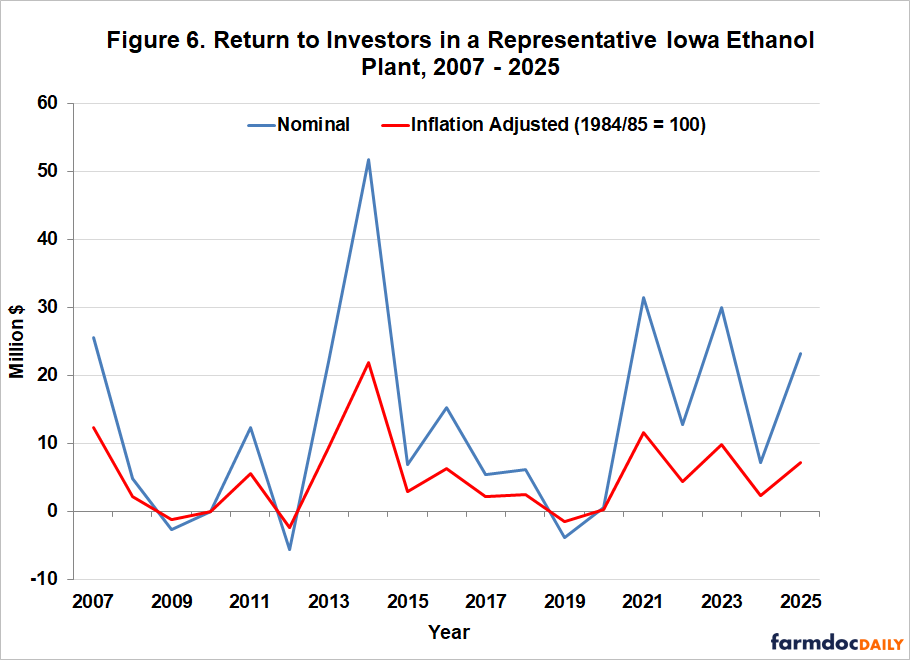
It is also useful to consider ethanol production profitability aggregated over an annual horizon for 2007 through 2025, as shown in Figure 6. Annual profits are presented in both nominal and inflation adjusted (real) terms. The nominal net profit of $23.2 million in 2025 was the sixth straight year of positive profits. There has only been one year with negative returns since 2013, which was 2019. The profit of $23.2 million in 2025 was only the sixth year since 2007 with profits above $20 million, and it was well-above the long-term average of $12.8 million. Profits in 2025 were not as impressive on an inflation-adjusted basis due to the burst of inflation in 2021-2023. Still, inflation-adjusted profit in 2025 of $7.2 million was also above the long-term average.
Implications
The U.S. ethanol industry delivered another strong year of profitability in 2025. Net returns for a representative Iowa plant averaged $0.21 per gallon, well above the long-run average of $0.13 per gallon since 2007. On an annual basis, nominal profits of $23.2 million marked the sixth consecutive year in positive territory and the sixth year since 2007 with profits exceeding $20 million. Given the headwinds facing the industry at the start of 2025—including trade policy uncertainty and a soft corn ethanol price environment—this is a genuinely impressive result.
A particularly noteworthy feature of 2025 profitability was the contribution of cellulosic ethanol production via corn kernel fiber (CKF) technology. Net returns attributable to cellulosic production averaged approximately $0.06 per gallon in 2025, driven by D3 RIN prices that averaged $2.34 per gallon. Without this additional revenue stream, profits for the representative plant would have averaged closer to $0.15 per gallon, still positive, but much nearer the long-run historical mean. This underscores how important the cellulosic ethanol premium has become to the bottom line of ethanol producers who have adopted CKF technology, and it highlights the sensitivity of overall industry profitability to the regulatory and market environment for D3 RINs.
Looking ahead, the profitability outlook for the ethanol industry will depend, as always, on the corn-to-ethanol price spread, the trajectory of RIN values under the U.S. Renewable Fuel Standard (RFS), and the pace of further adoption of efficiency-enhancing technologies such as CKF conversion. An additional and potentially important new source of revenue not captured in our current model is the 45Z Clean Fuel Production Credit. The changes to this tax credit in the Big Beautiful Bill passed last July are likely to meaningfully alter the economics of ethanol production going forward. This will be an important issue to monitor and analyze in 2026.
References
Irwin, S. "Trends in the Operational Efficiency of the U.S. Ethanol Industry: 2025 Update." farmdoc daily (16):26, Department of Agricultural and Consumer Economics, University of Illinois at Urbana-Champaign, February 18, 2026.
Irwin, S. "2024 Ethanol Production Profits: Regression to the Mean?" farmdoc daily (15):42, Department of Agricultural and Consumer Economics, University of Illinois at Urbana-Champaign, March 5, 2025.
Irwin, S. "Another Strong Year for Ethanol Production Profits in 2023." farmdoc daily (14):29, Department of Agricultural and Consumer Economics, University of Illinois at Urbana-Champaign, February 12, 2024.
Irwin, S. "A Solid Year for Ethanol Production Profits in 2022." farmdoc daily (13):52, Department of Agricultural and Consumer Economics, University of Illinois at Urbana-Champaign, March 22, 2023.
Kurambhattia, C.V., D. Kumar, K.D. Rausch, M.E. Tumbleson, and V. Singh. “Increasing Ethanol Yield through Fiber Conversion in Corn Dry Grind Process.” Bioresource Technology 270(2018):742-745. https://www.sciencedirect.com/science/article/abs/pii/S0960852418313737
Disclaimer: We request all readers, electronic media and others follow our citation guidelines when re-posting articles from farmdoc daily. Guidelines are available here. The farmdoc daily website falls under University of Illinois copyright and intellectual property rights. For a detailed statement, please see the University of Illinois Copyright Information and Policies here.