


The Iran Conflict: Potential Impacts on 2026 Corn and Soybean Returns
The current conflict in the Middle East has increased the prices of energy and fertilizers. Impacts on corn and soybean prices are more difficult to determine. Here, we examine price movements since the start of airstrikes from the United States (U.S.) and Israel on February 28. The overall impact on costs will depend on the length of the conflict. In particular, energy and fertilizer prices could increase more if the Strait of Hormuz remains closed for a lengthy period, or if long-term Iranian oil production is seriously degraded. While many inputs for 2026 have already been purchased, profitability prospects for this year are likely reduced. Cost increases could also be felt in future years.
Background
The U.S. and Israel began a bombing attack on Iran on February 28, 2026. Iran is in the Middle East, which is a major supply region for crude oil, natural gas, and fertilizers. Like in the past, conflicts in the Middle East threaten global energy supplies and increase economic uncertainty, thereby increasing global prices.
Although a major supplier of energy-related products, the Middle East is not a large producer of agricultural products and, in fact, imports many agricultural products (see Glauber). As a result, conflicts in this area do not significantly endanger global agricultural supplies, unlike the Ukraine-Russia conflict, in which large areas of Ukraine were affected. Global agricultural stocks may actually increase as conflict in the region could reduce the amount of agricultural products moving into the Middle East. Therefore, a large, immediate increase in agricultural commodity prices is less likely than during the Ukraine-Russia conflict.
Note that the 2026 U.S. planting season is very near, and most farmers have already made most production decisions. Major shifts in acreages are unlikely, as the majority of inputs have been priced and ordered. Fuel for spring operations is in place on many farms. Most phosphorus and potash fertilizers have been applied. Spring and post-plant nitrogen will still need to be applied, but those inputs may already be priced on most situations. On many farms, the costs of seed, fertilizers, and chemicals have largely been determined. Still, some farmers still need to purchase inputs. Moreover, fuel and other inputs for the summer and fall still need to be purchased in most forms.
In the following sections, we compare price movements before and after the conflict began at the end of February. As is always the case, other supply and demand factors have influenced prices in recent weeks. Hence, price changes may not be entirely due to the Iran conflict. Still, price movements indicate the direction of impacts. We will show changes for 1) corn and soybean prices, 2) crude oil prices, and 3) fertilizer prices.
Corn and Soybean Prices
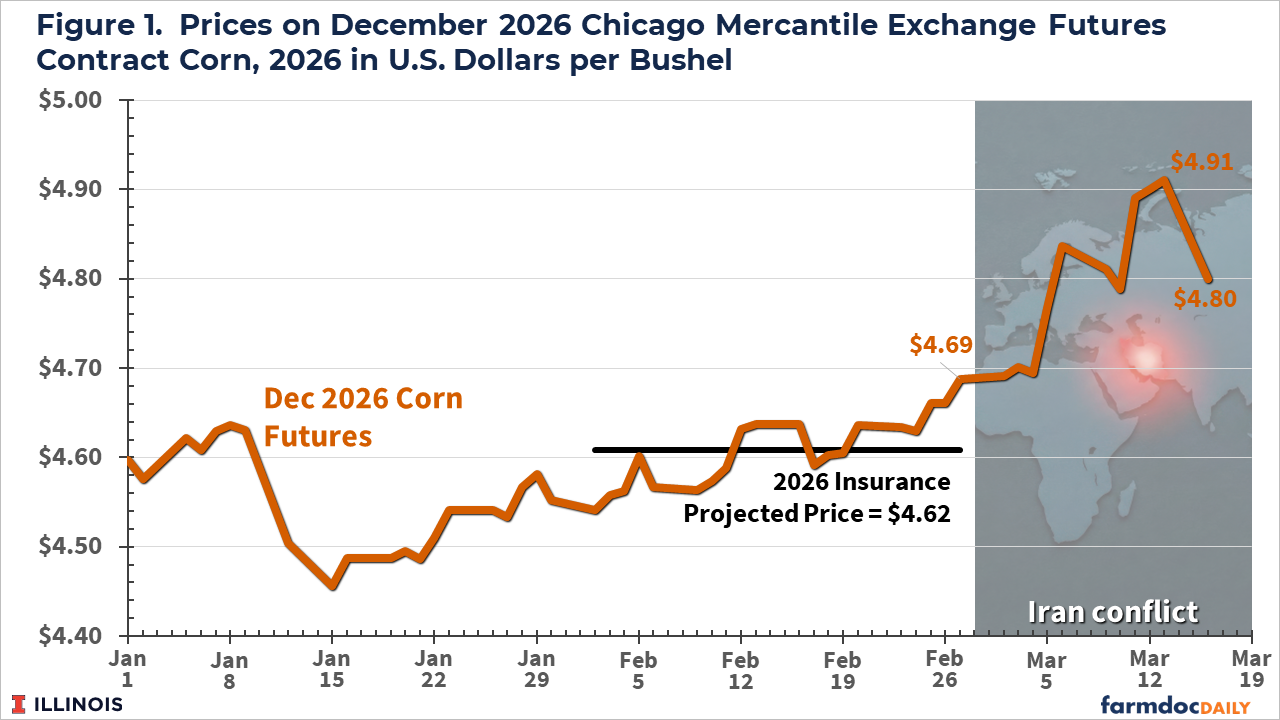
Prices on harvest-time futures contracts for both corn and soybeans provide good indicators of expected price levels at harvest. Both corn and soybean prices have increased since February 27, followed by a sharp fall on March 16th. The December 2026 futures price for corn on the Chicago Mercantile Exchange was $4.69 on February 27. Since February 27, corn prices have been on a general upward trend, reaching $4.90 on March 13th, an increase of $ 0.31 over the February 26 price (see Figure 1).
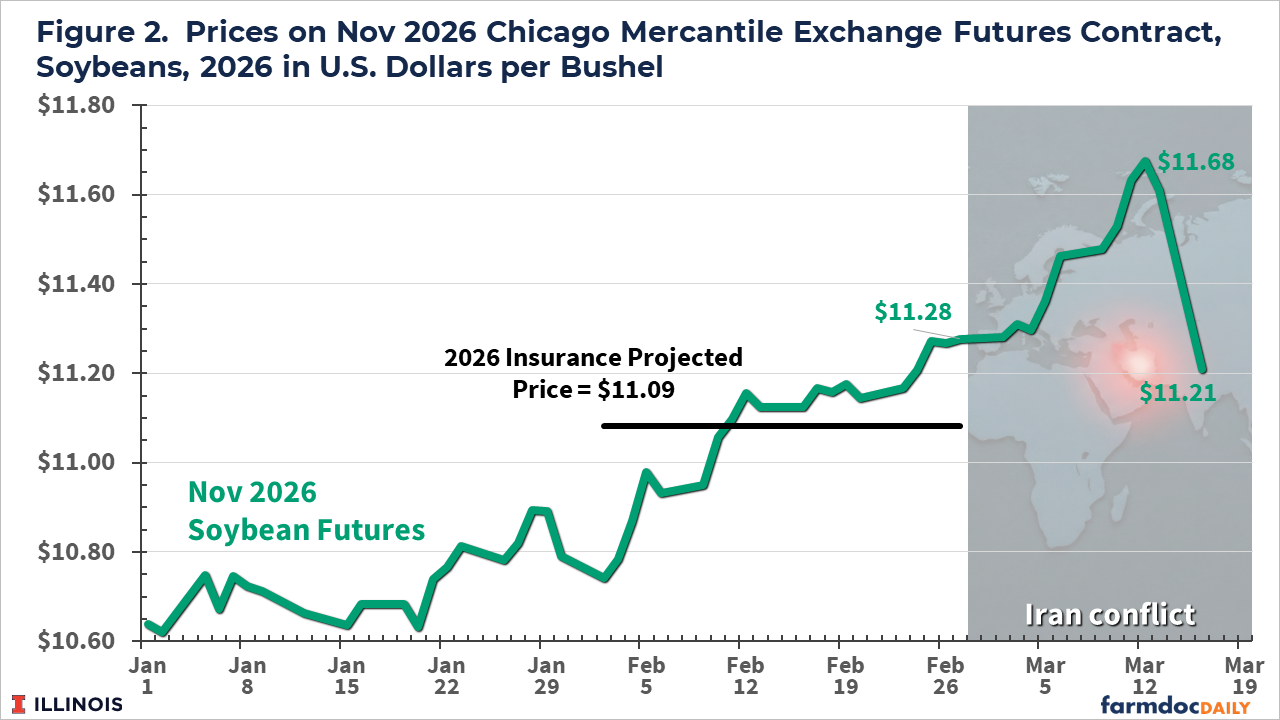
For soybeans, the November 2026 futures price on CME was $11.28 per bushel on February 27. From February 17, soybean futures prices have increased on most days, reaching $11.68 on March 12, an increase of $ 0.40. Then, prices fell to $11.61 on March 13 and $11.21 on March 16. The latter fall has been attributed to the prospect that President Trump will not meet with China’s Premier Xi Jinping, potentially leading to no or few additional U.S. soybean exports to China in 2026.
How much of the above price changes is due to the Iran Conflict is an open question. Overall projections of acres, stocks, and uses play a role in those price changes. Still, geopolitical events do affect agricultural commodity prices.
Energy Prices
Most Middle East conflicts affect energy markets, and this one is no exception. Crude oil prices have increased precipitously. In February, spot crude oil prices in Cushing, Oklahoma, averaged $64.51 per barrel, with a price of $66.96 on February 27. Since February 28, crude oil prices have increased to over $90 per barrel (see Figure 3).
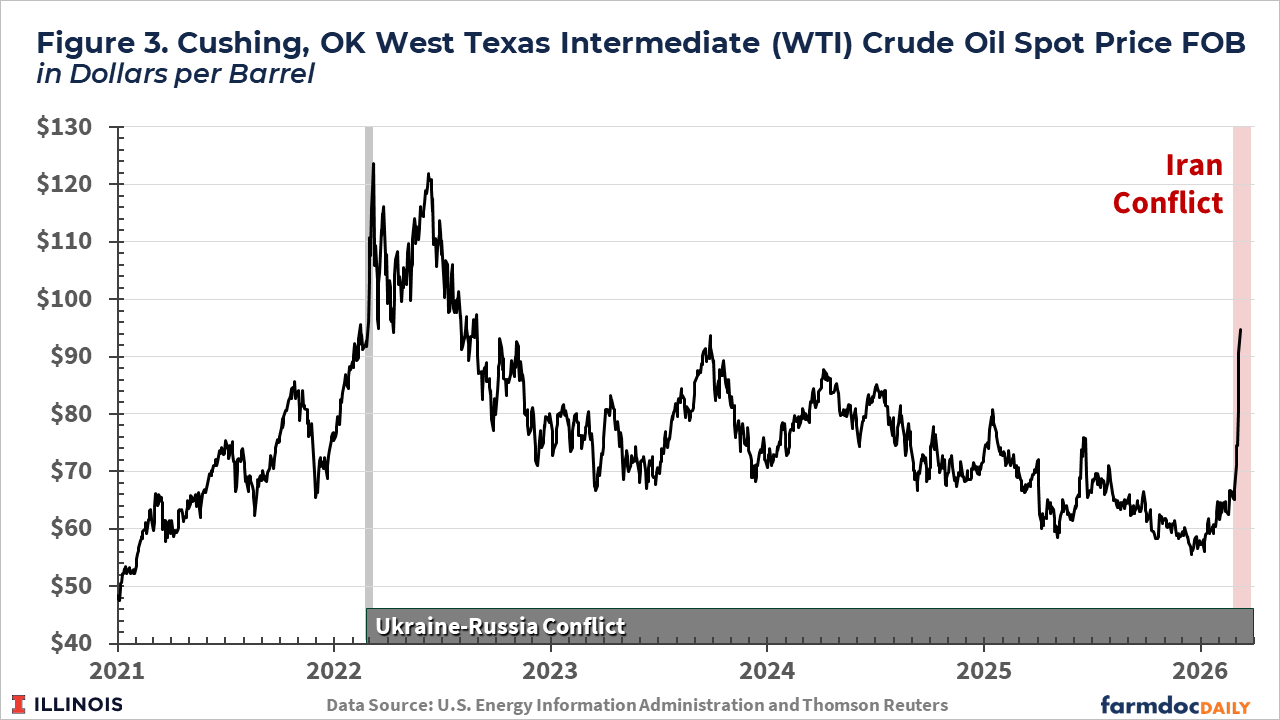
A recent high for crude oil occurred in 2022 when the Ukraine-Russia conflict began. During that period, crude oil prices reached levels above $120 per barrel. Crude oil then began a general downward trend, reaching lows below $60 per barrel at the beginning of 2026. Recent increases have not reached the $120 per barrel level. The length of the Conflict and its impact on the Strait of Hormuz could see higher crude oil prices, with oil executives warning of a prolonged period of higher prices than before February 28 (Eaton and Morene).
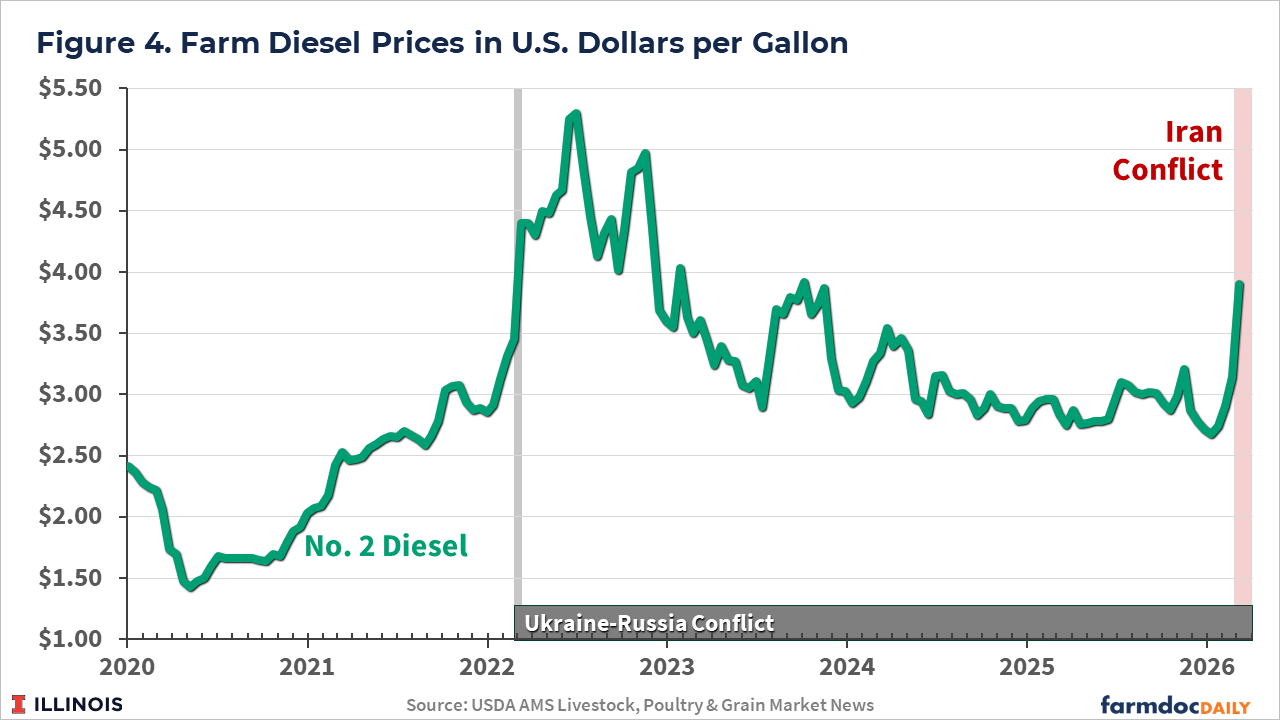
Those crude oil price increases are being transmitted to farmers. In its March 6th report on Illinois Production Costs, the Agricultural Marketing Service reported diesel fuel prices at $3.90 per gallon, up by $ 0.76 from the previous level of $3.14 per bushel (see Figure 4). If crude oil continues to rise, diesel fuel prices could be above $4.50 per gallon, similar to the last time crude oil prices exceeded $120 per barrel.
In and of itself, crude oil accounts for a small share of crop costs. For central Illinois high-productivity land, fuel costs for corn represent $24 per acre, or 3% of the $808 total non-land costs (see Illinois Crop Budgets). However, high fuel costs translate to higher costs for many other goods, including consumer consumption goods and services. Fuel plays a role in the production of most agricultural inputs and is involved in the transportation of agricultural products. Sustained higher energy prices may lead to another round of inflation.
Fertilizer Prices
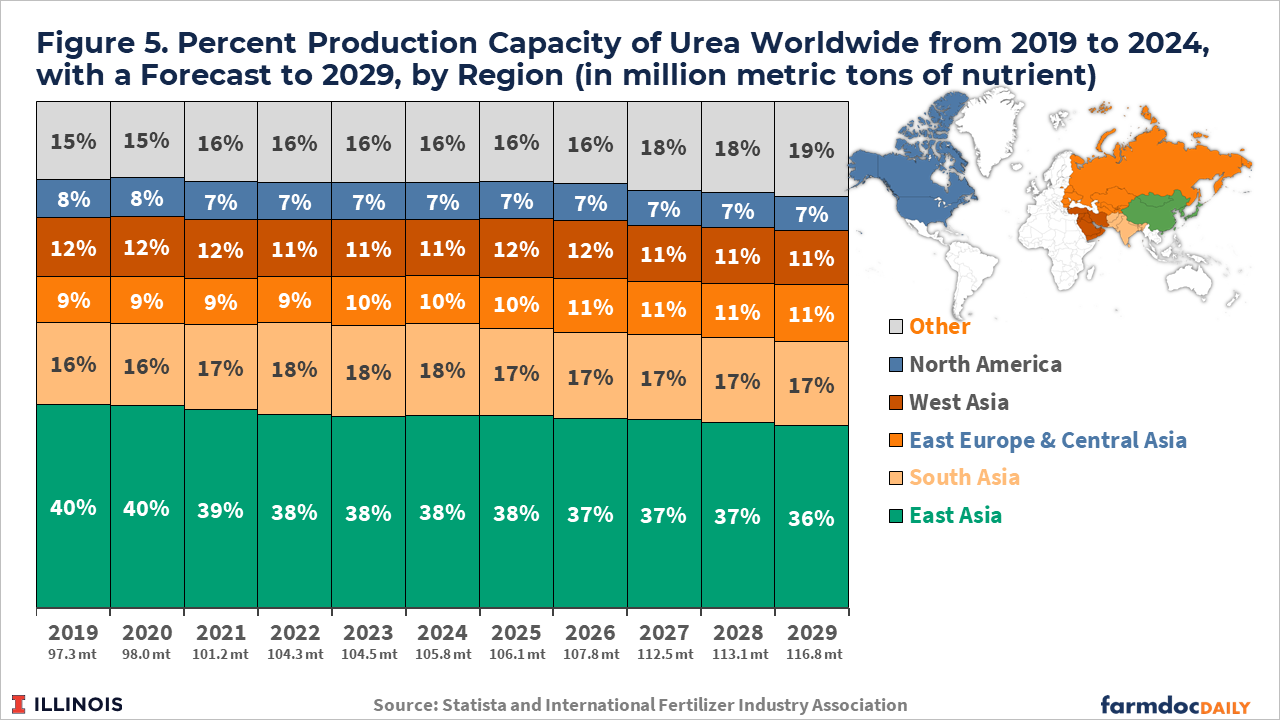
The Middle East is a major source of natural gas, an input into nitrogen fertilizer production. Around 10% of the world’s urea is produced in the Middle East (see Figure 5). Disturbances in the Middle East can have a major impact on nitrogen and phosphate fertilizers.
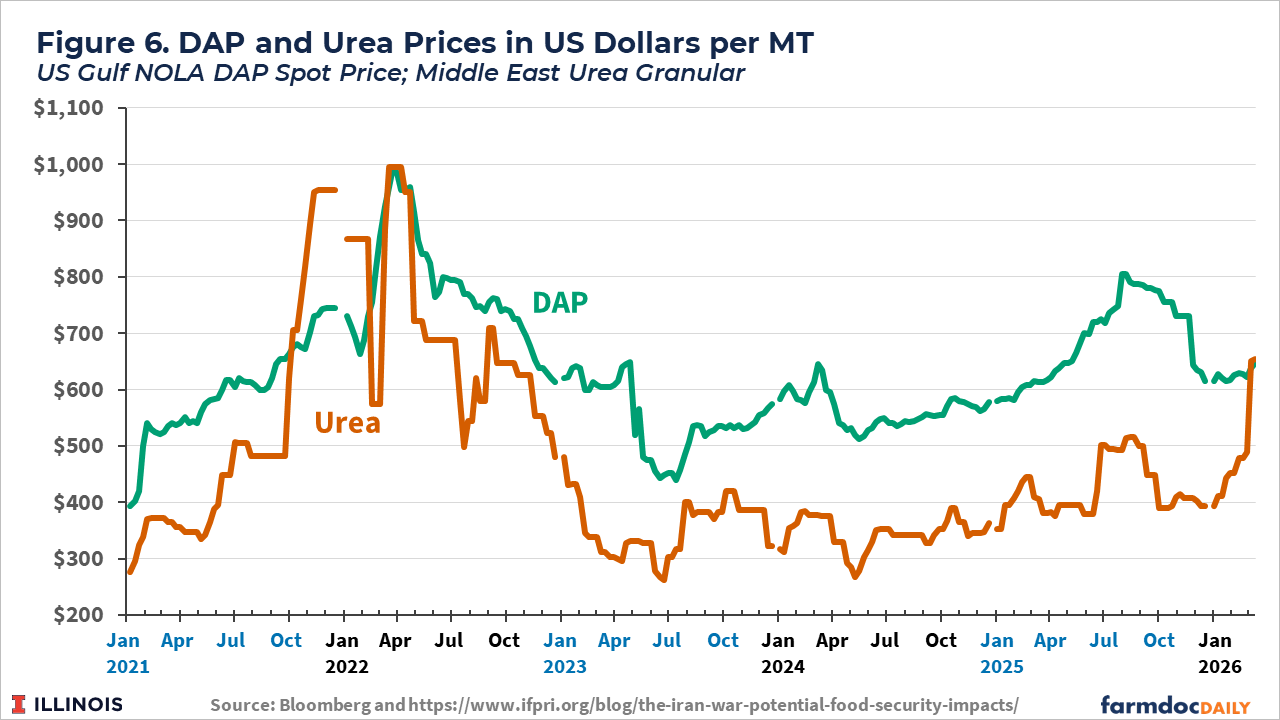
Wholesale nitrogen fertilizers increased after the February 28th bombing campaign began. Before February 27, wholesale urea prices at New Orleans were below $500 per ton. On March 13, prices were over $650 per ton (see Figure 6).
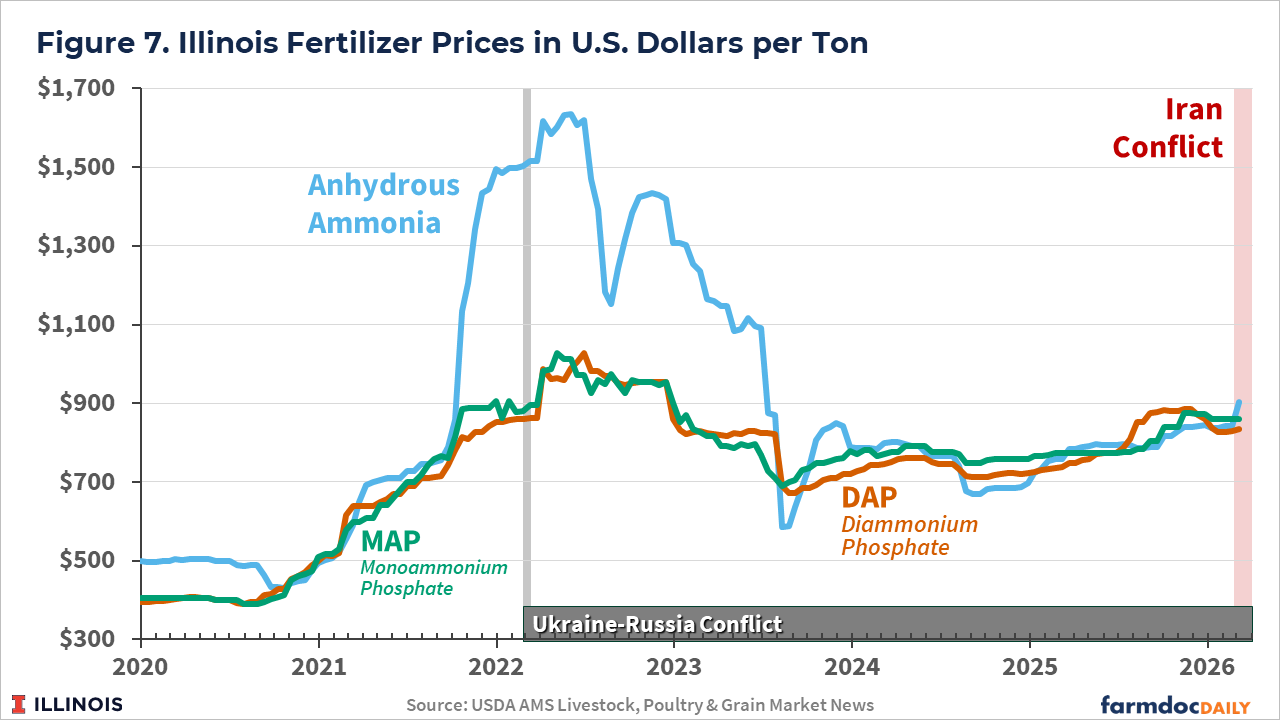
Most farmers have already pre-priced or applied much of their nitrogen fertilizers for the 2026 crop. Those who have not priced all nitrogen fertilizers will face higher costs, with AMS already reporting Anhydrous ammonia at over $900 per ton (see Figure 7). Obtaining a firm price on nitrogen at this point may be difficult. Farmers in this situation may decide to switch some acreage from corn to soybeans, as soybeans do not require nitrogen. With planting very near, most inputs are already in place, and large shifts in planting intentions seem unlikely. Still, some acres could switch, with the most likely direction being away from corn to soybeans.
Summary
Conflicts in the Middle East are raising energy and fertilizer prices, which will affect 2026 corn and soybean returns. While corn and soybean prices increased following the start of the conflict, both have had sharp declines since March 13th. The impacts of fertilizer cost increases this year may not be large on many farms, as a significant portion of the purchases of these inputs have already occurred. If the Conflict continues, the longer run impact may be higher costs across all inputs if energy prices remain elevated and work their way through the supply chain for all goods and services.
References
Eaton, Collin, and Benoit Morenne. “Oil Industry Warns Trump Administration That Fuel Crunch Will Likely Worsen.” Wall Street Journal, March 15, 2026. https://www.wsj.com/business/energy-oil/oil-industry-warns-trump-administration-energy-crisis-will-likely-worsen-0a5c8b1a
Glauber, Joseph. “The Iran War: Potential Food Security Impacts.” IFPRI Blog, March 6, 2026. https://www.ifpri.org/blog/the-iran-war-potential-food-security-impacts/
Wescott, Ben, and Elanor Thornber. “Soybeans Slump More Than 3% on Possible US-China Talk Delays.” Bloomberg, March 15, 2026. https://www.bloomberg.com/news/articles/2026-03-16/soybeans-slump-more-than-2-on-potential-us-china-talks-delay?embedded-checkout=true
Disclaimer: We request all readers, electronic media and others follow our citation guidelines when re-posting articles from farmdoc daily. Guidelines are available here. The farmdoc daily website falls under University of Illinois copyright and intellectual property rights. For a detailed statement, please see the University of Illinois Copyright Information and Policies here.