


Illinois Farmland Turnover Rates: 2003–2025
This article examines Illinois farmland turnover rates from 2003 through 2025, evaluating transactional activity across regions of the state and by quarter. Farmland sales volume is a critical metric for real estate professionals, farm operators seeking to expand, and investors evaluating the fundamentals that attract capital to this asset class. While property transfer records are typically public, electronic accessibility varies by state and era, and disclosure methods lack standardization. Farms are classified by land type and use; consequently, parcels meeting agricultural tax definitions may actually function as development tracts or lack commercial farm viability. Furthermore, unambiguously identifying “arm’s-length” transactions in historic sales records remains a persistent challenge.
Illinois maintains a reasonably detailed and accessible collection of post-sale transfer declarations known as PTAX-203 records. Before electronic records were available, the TIAA Center for Farmland Research and the University of Illinois maintained annual updates from physical state archives dating back to the 1980s. Evolving forms and tax disclosures created different data regimes, requiring controls for variations in price per acre, parcel size, and improvements. To align with the Illinois Society of Professional Farm Managers and Rural Appraisers (ISPFMRA) annual report, this study examines sales from 2003 through 2025, recorded as of January 1, 2026. A 2011 data system change requires slightly different pre- and post-2011 treatments, though these are verifiable. Turnover rates were calculated using US Ag Census total farmland acreage at both the county and state levels.
Illinois accounts for a large share of Corn Belt output with over 26 million highly productive acres, and its market transactional features are likely to represent the broader region. Despite its large acreage, relatively little farmland changes hands annually. Of the transferred portion, a meaningful fraction moves within multigenerational operations or related entities, outside of publicly marketed transactions. Due to these thin market conditions, modest shifts in transactional rates represent outsized jumps in market activity. For example, moving from a 1.5% to a 2.0% turnover rate yields a 33.3% increase in annual parcel sales. Thin markets provide strong support for asset values during downturns, and strong sales periods tend to bring a bit more land to market than long-term average annual rates.
To construct a consistent definition of market-relevant transactions, Illinois property transfer records were screened against several criteria. The following results include parcels between 10 and 1,281 acres, effectively excluding most rural residential properties while retaining commercial operations up to two full sections. Sales above that limit were individually examined and verifiable arm’s-length transactions over 1,281 acres were retained to avoid excluding economically relevant data, but accounting for less than one sale per year during the sample.
Transactions were further screened using price-per-acre thresholds to limit the influence of data errors, development parcels, and non-representative sales. Transfers recording nominal consideration, frequently $1, for trust reorganizations or internal adjustments were excluded, as they do not represent open market price discovery. Transfers between related parties were also removed to ensure the sample reflects arm’s-length transactions accessible to the broader market.
Because transfer declarations were revised during the sample period, related-party reporting definitions evolved. While updated forms improved detail, they complicated the identification of non-arm’s-length sales or financing concessions. To preserve consistency, Figure 1 presents harmonized annual turnover rates from 2003 through 2025, accommodating the 2011 transition where both data systems uniquely existed.
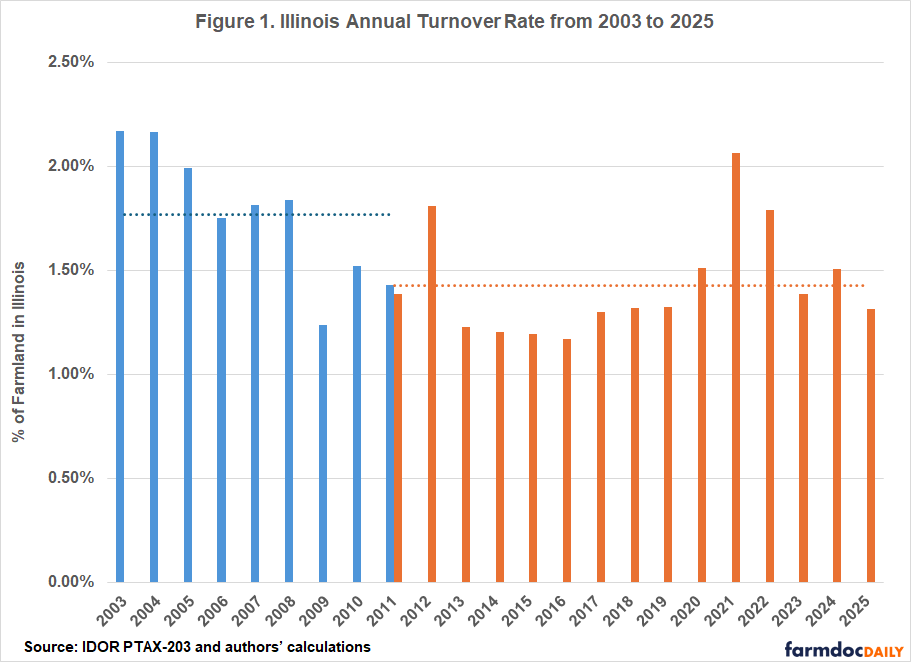
Turnover in Illinois remained structurally low throughout the period, averaging 1.77% of total farmland from 2003–2011 and 1.45% from 2012–2025 (the latter may rise slightly upon final reporting). In the early sample, turnover exceeded 2.0% only in 2003 and 2004, coinciding with strong price appreciation. Turnover again more than 2.0% in 2021, following a period of improved crop margins, historically low borrowing costs, and pandemic-era government support. These factors strengthened farm balance sheets and provided the robust liquidity needed for acquisitions.
The turnover rate can be used to infer an average holding period by simply inverting the ratio to determine how long it would take for a complete turnover on average. The sample’s 1.561% average annual turnover implies a complete land base turnover takes roughly 64 years. While individual ownership varies, farmland changes hands much slower than other real estate.
Table 1 reports total farmland acreage by county, serving as the basis for turnover calculations. Farmland is heavily concentrated in central and northern Illinois. Iroquois, LaSalle, McLean, and Champaign counties each exceed half a million acres, highlighting the region’s agricultural scale. Multigenerational ownership tied to operating farms reinforces stability in these areas. However, turnover is not uniform; farm size, ownership structures, urban influence, and local markets drive meaningful regional variation.
Table 1. Illinois Land in Farms by County (2022 Census of Agriculture)
| County | Acres | County | Acres |
| Adams | 423,666 | Lee | 377,886 |
| Alexander | 62,494 | Livingston | 606,271 |
| Bond | 161,590 | Logan | 380,340 |
| Boone | 124,244 | McDonough | 277,887 |
| Brown | 163,236 | McHenry | 184,403 |
| Bureau | 455,336 | McLean | 597,397 |
| Calhoun | 106,067 | Macon | 259,085 |
| Carroll | 261,931 | Macoupin | 458,695 |
| Cass | 156,808 | Madison | 264,765 |
| Champaign | 545,674 | Marion | 246,697 |
| Christian | 350,778 | Marshall | 206,667 |
| Clark | 249,166 | Mason | 324,668 |
| Clay | 227,457 | Massac | 127,131 |
| Clinton | 276,216 | Menard | 155,670 |
| Coles | 214,931 | Mercer | 251,455 |
| Cook | 10,281 | Monroe | 197,346 |
| Crawford | 234,709 | Montgomery | 379,349 |
| Cumberland | 161,892 | Morgan | 283,082 |
| De Kalb | 353,524 | Moultrie | 197,600 |
| De Witt | 180,145 | Ogle | 351,824 |
| Douglas | 217,560 | Peoria | 278,241 |
| Du Page | 819 | Perry | 174,088 |
| Edgar | 325,023 | Piatt | 228,142 |
| Edwards | 117,890 | Pike | 481,175 |
| Effingham | 281,772 | Pope | 77,364 |
| Fayette | 328,888 | Pulaski | 99,694 |
| Ford | 279,456 | Putnam | 51,822 |
| Franklin | 174,342 | Randolph | 254,611 |
| Fulton | 435,773 | Richland | 214,131 |
| Gallatin | 174,434 | Rock Island | 144,843 |
| Greene | 319,730 | St. Clair | 287,115 |
| Grundy | 188,601 | Saline | 159,177 |
| Hamilton | 223,423 | Sangamon | 464,740 |
| Hancock | 417,260 | Schuyler | 207,067 |
| Hardin | 34,138 | Scott | 104,741 |
| Henderson | 199,669 | Shelby | 359,447 |
| Henry | 449,705 | Stark | 162,962 |
| Iroquois | 669,168 | Stephenson | 305,770 |
| Jackson | 291,160 | Tazewell | 344,083 |
| Jasper | 246,336 | Union | 140,501 |
| Jefferson | 232,182 | Vermilion | 445,066 |
| Jersey | 161,192 | Wabash | 118,306 |
| Jo Daviess | 309,287 | Warren | 279,691 |
| Johnson | 108,064 | Washington | 326,641 |
| Kane | 146,717 | Wayne | 302,602 |
| Kankakee | 322,007 | White | 258,774 |
| Kendall | 129,224 | Whiteside | 335,899 |
| Knox | 440,387 | Will | 241,269 |
| Lake | 32,226 | Williamson | 103,673 |
| La Salle | 603,762 | Winnebago | 167,697 |
| Lawrence | 186,482 | Woodford | 277,669 |
| Illinois Total | 26,292,041 |
(Source: USDA 2022 Census of Agriculture)
Figure 2 illustrates the geographic distribution of sales across the state. The reported rates reflect total qualifying farm sales, as defined in this study, divided by USDA measures of land in farms for each county. Because turnover is a percentage of total farmland, counties with smaller agricultural bases may exhibit elevated rates from just one or two large transactions.
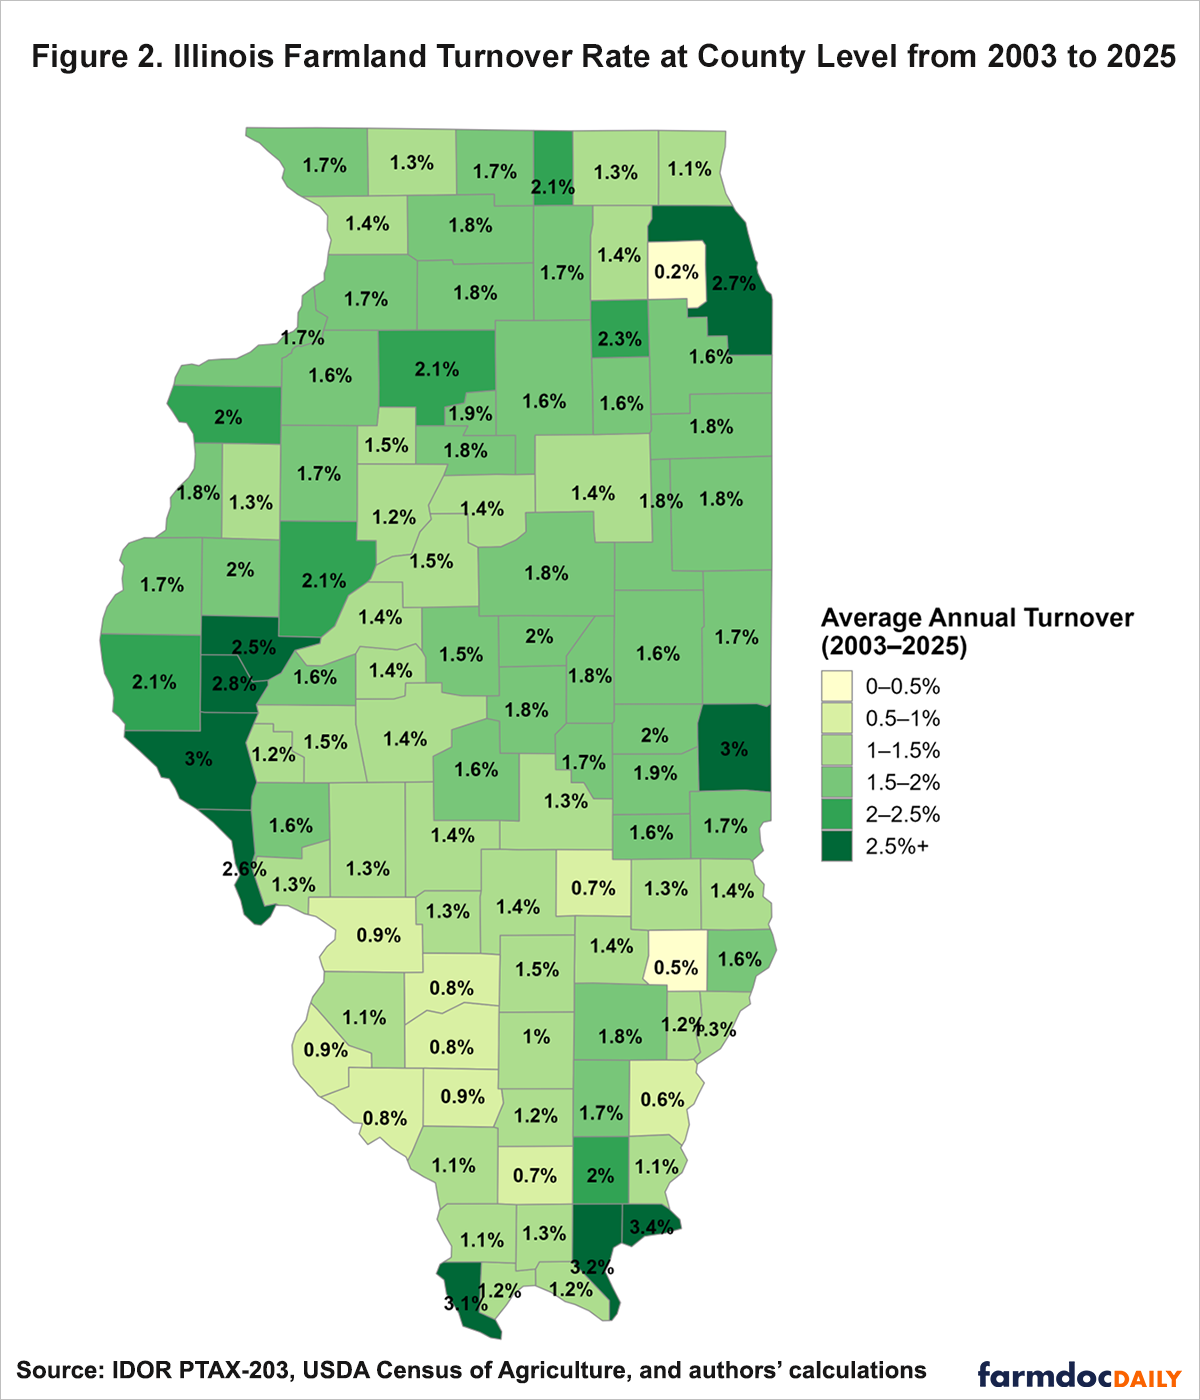
The county map reveals substantial geographic heterogeneity. Urban fringe counties near Chicago show minimal agricultural turnover due to limited farmland and continuous development pressure; agricultural sales here are a tiny fraction of land market activity. In contrast, northern and central Illinois exhibit higher turnover, particularly west of the Illinois River and northeast of St. Louis. These highly productive, agricultural counties contrast with the southern region. Across the central corridor, turnover tightly clusters near the 1.3% to 1.6% statewide average.
While annual rates track slow-moving long-term macroeconomic and agricultural conditions, within-year patterns reflect the annual crop cycle. Figure 3 segments data quarterly to highlight these clear seasonal transaction dynamics. The first and fourth quarters consistently record the highest transaction volumes, while the second and third remain subdued. This pattern holds remarkably steady across the sample: Q1 = 31.0%, Q2 = 23.9%, Q3 = 17.0%, and Q4 = 28.1%.
Fourth-quarter concentration reflects both post-harvest timing and year-end tax planning. Sellers often aim to close before December 31, while buyers secure land ahead of spring planting. First-quarter activity captures closings from late-year listings or winter negotiations. This seasonal rhythm persists across all economic cycles, commodity expansions, and margin compressions. Even during 2021’s high activity, the Q4 and Q1 concentrations remained evident.
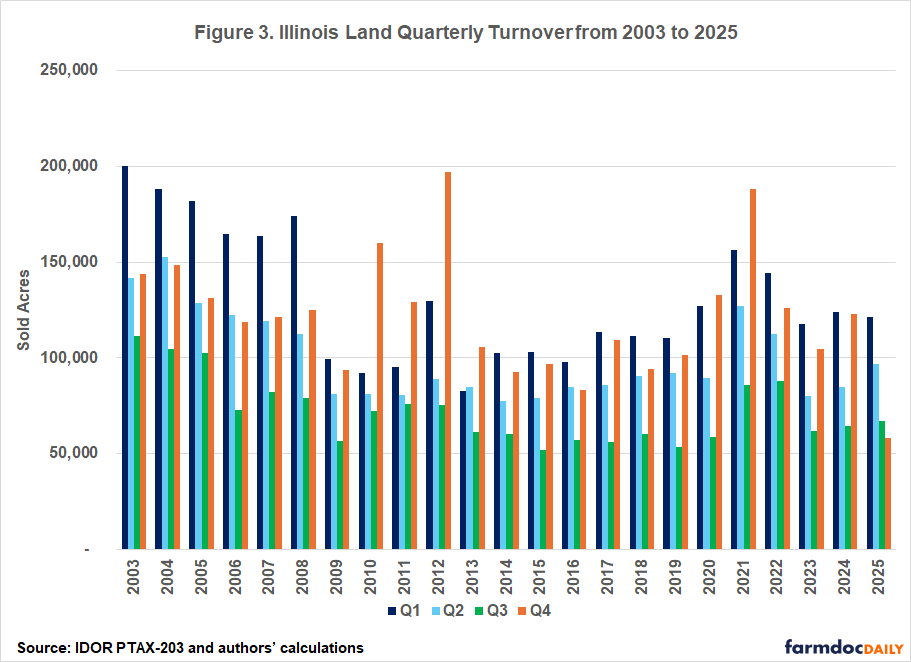
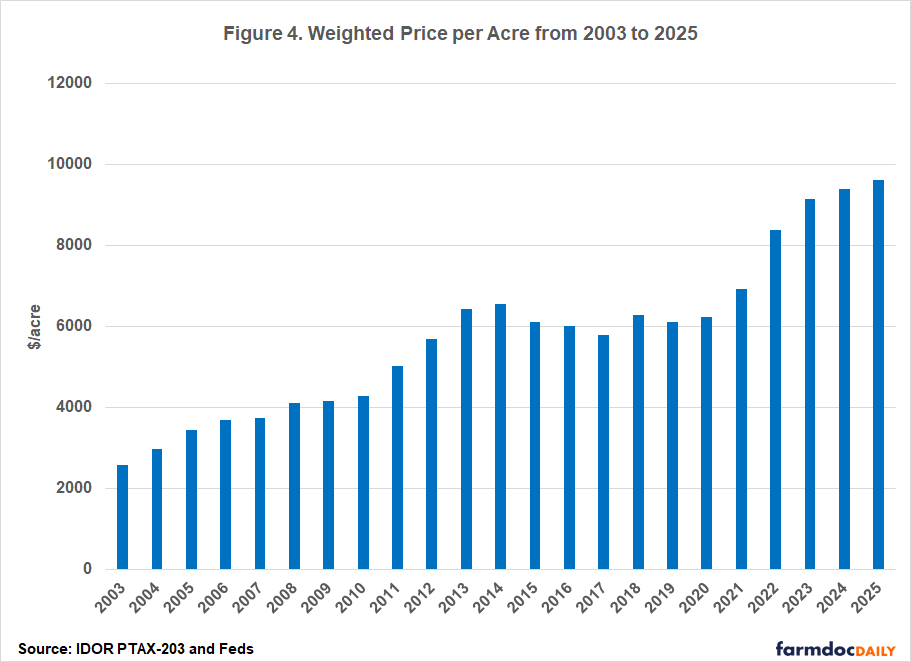
Figure 4 displays weighted average price per acre from 2003 through 2025. Between 2003 and 2020, prices climbed steadily from roughly $2,500 to over $6,000 per acre, supported by improving commodity markets, farm income, and favorable financing. The acceleration beginning in 2021 broke this prior trend. As inflation surged and margins strengthened, land values spiked, surpassing $8,000 per acre in 2022 and nearing $10,000 by 2025. These statewide averages blend all soil productivity ratings, though actual prices vary dramatically by local parcel quality.
In summary, Illinois farmland turnover follows consistent patterns mirroring the broader Corn Belt, though at significantly lower levels than other real estate forms. Even through multiple economic cycles including commodity expansions, margin compression, financial market stress, and the recent inflation surge, the volume of land changing hands fluctuated within a narrow range relative to total supply. However, due to the thin market, small percentage shifts still represent large variations in annual parcel sales. Given the large total value of the asset class, a relatively small turnover rate remains sufficient for accurate pricing with respect to market fundamentals, and thus should not be viewed as either a problem or a source of non-market distortions.
Disclaimer: We request all readers, electronic media and others follow our citation guidelines when re-posting articles from farmdoc daily. Guidelines are available here. The farmdoc daily website falls under University of Illinois copyright and intellectual property rights. For a detailed statement, please see the University of Illinois Copyright Information and Policies here.