


Paraguay’s Role in the Global Soybean Market
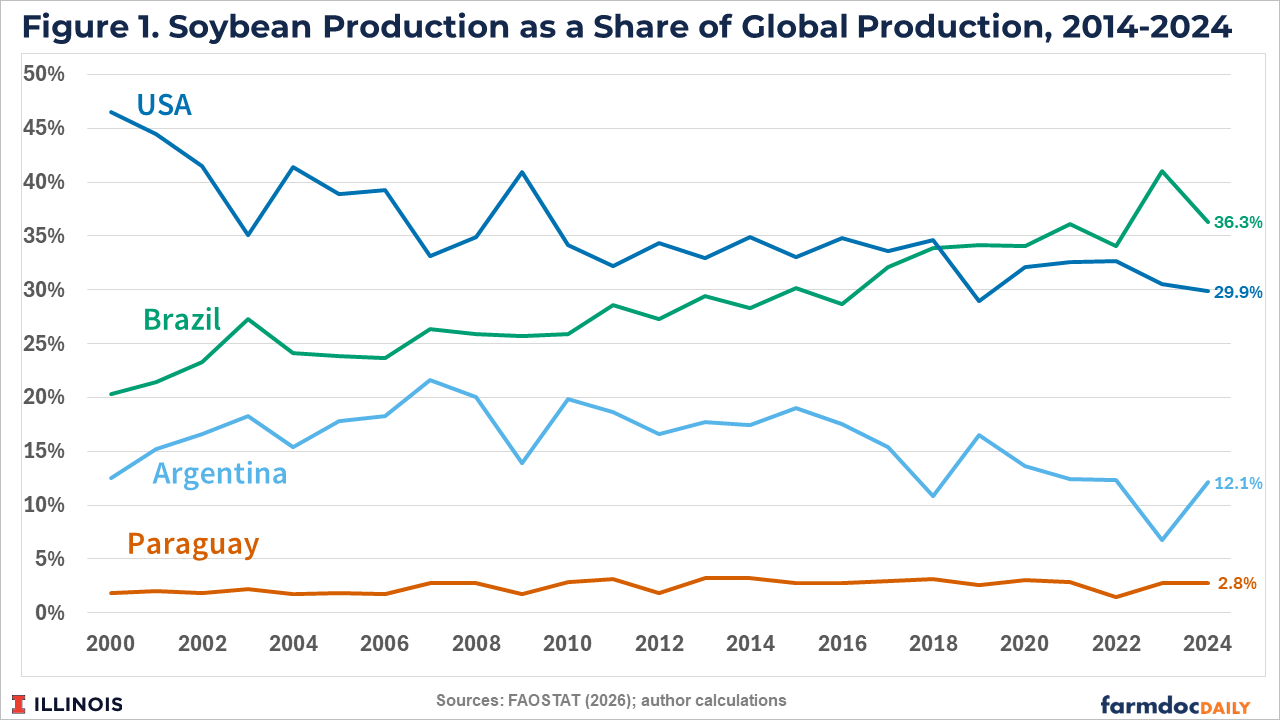
Global soybean production is viewed as dominated by Brazil, the United States, and, to a lesser extent, Argentina. The three countries typically account for around 80% of global soybean production and 88% of global exports. However, other South American countries have significantly increased soybean production over the past 50 years. Paraguay is one such country. It accounts for less than 3% of global soybean production but has the potential for a larger role in global trade due to heavy export market reliance and highly variable yields.
Soybean in Paraguay
The main soybean crop in Paraguay (referred to as zafra) is planted starting in late August and through early November. Harvest occurs from as early as late December into March. A second smaller soybean crop (referred to as zafriña) can be planted in late January to early February, with harvest from May through July. Soy-corn or corn-soy rotations have become more common but planting consecutive soybean crops continues to occur.
Compared with Brazil, the US, and Argentina, Paraguay accounts for a relatively small share of global soybean production: just under 3% (see Figure 1). Brazil’s production share has trended up, reaching over 35% in recent years while the US share has trended down to around 30%. Argentina’s production share has also declined but has generally remained between 10 and 15% of global production.
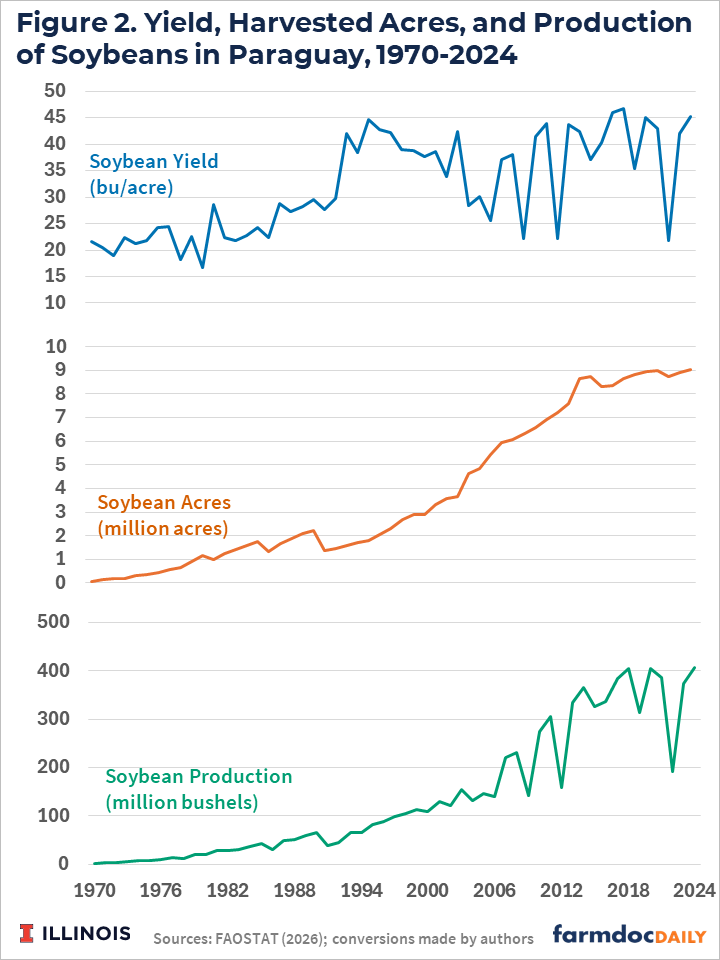
Since 1970, soybean production in Paraguay has increased, surpassing 400 million bushels multiple times in recent years (see upper panel of Figure 2). Increases in production have been achieved through increased productivity and acreage expansion.
As shown in the middle panel of Figure 2, soybean acres have increased over time in Paraguay with more rapid increases occurring from the 1990s through the 2000s. Acreage has plateaued at 8.6 to 8.9 million acres (3.5 to 3.6 million hectares) as expansion has slowed considerably in recent years. Industry estimates suggest some potential for additional expansion over time, up to 741,000 acres (300,000 hectares), into the Chaco region of northwestern Paraguay. However, this potential is highly limited by relatively poor soils and lack of existing infrastructure in the region (USDA, 2026).
Soybean yields in Paraguay have trended up through time, with recent yields exceeding 45 bushels per acre in good years (lower panel of Figure 2). Over the past 10 years, average soybean yields have ranged from a high of nearly 47 bushels per acre in 2018 to a low of less than 22 bushels per acre in 2022 under serious drought conditions. Yield potential for the main zafra crop in Paraguay is similar to that of the US and Brazil in good growing seasons. USDA estimates suggest 2025/26 zafra yields could exceed 56 bushels per acre and a total crop of nearly 445 million bushels (12.1 million metric tons) (USDA, 2026).
Soybean yield variability in Paraguay has been larger than in the US and Brazil over the past 25 years (see Figure 3). Soybean yields have been at least 10% below trend in 7 of the last 25 years, compared with 4 years in Brazil and just 2 years in the US. Yield losses exceeding 40% below trend occurred in 2022 and 2012, growing seasons impacted by major drought conditions. The average deviation in years with yields below trend is 22% in Paraguay, 6.9% in Brazil, and 4.4% in the US. Positive yield deviations have also tended to be larger, averaging 12.4% in Paraguay, 5.4% in Brazil, and 4% in the US.
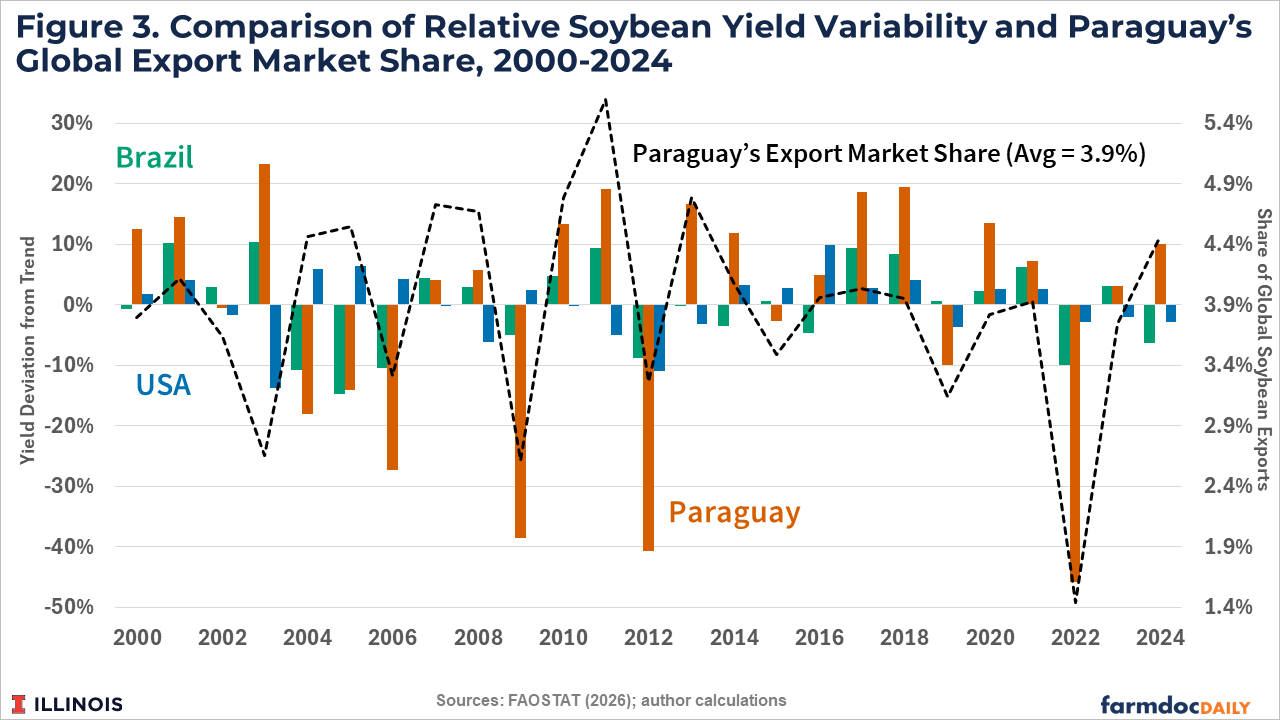
Yield performance in Paraguay is associated with market share in total soybean exports. Since 2000, Paraguay has accounted for an average of 3.9% of global soybean exports (see the dashed black line series in Figure 3). Paraguay’s export share has been lower during poor growing seasons such as 2022 (1.4%), 2012 (3.2%), 2009 (2.6%), and 2006 (3.3%). This share tends to be larger in good growing seasons (i.e. 4.8% in 2010 and 5.6% in 2011) and also during seasons where yields in the larger markets of the US and Brazil are relatively poor (i.e. 4.5% in 2004 and 2005).
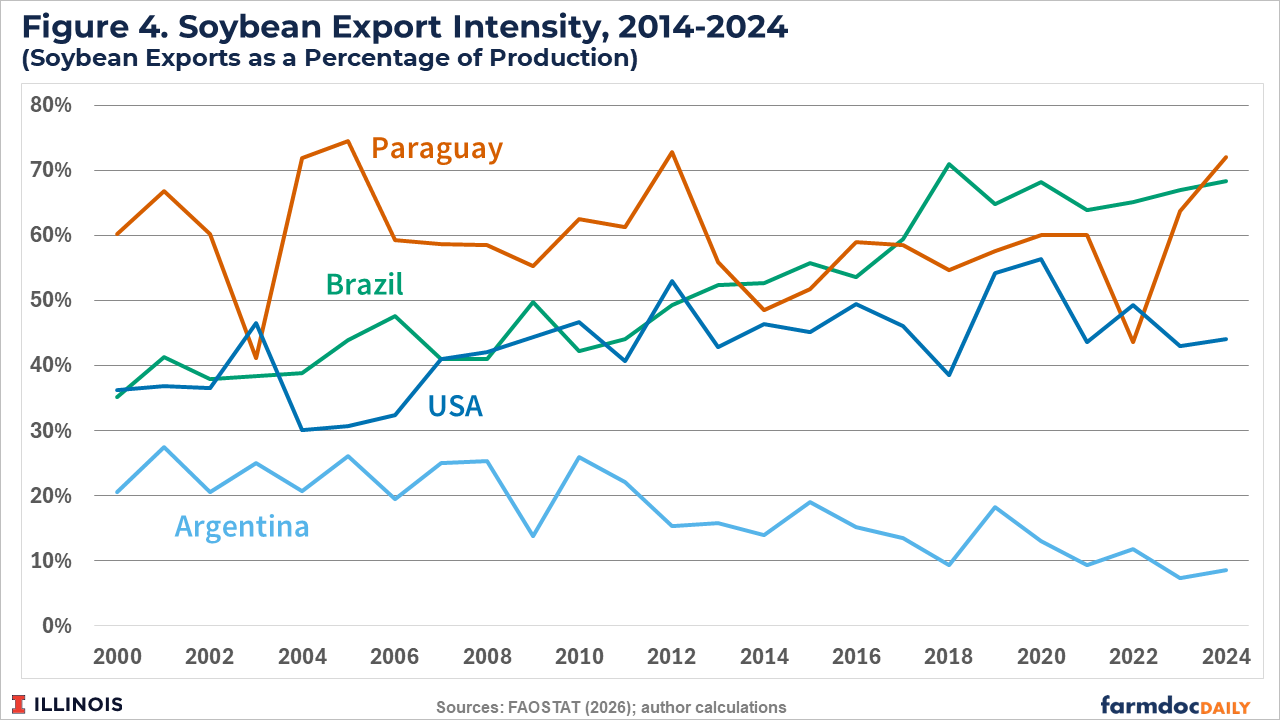
Paraguay is heavily reliant on export demand, with an average export to production ratio of around 60% (see Figure 4). Brazil’s export ratio has been 65% in recent years while the US export ratio is generally between 40% and 50%.
Domestic crush capacity is expected to reach 4.7 million metric tons (nearly 173 million bushels) in the 2026/27 marketing year given recent investments. Other domestic use is, and is expected to remain, fairly negligible (USDA, 2026).
75 to 85 percent of Paraguay’s soybean exports flow to Argentina to feed its large soy crush complex. Argentina is the world’s largest exporter of soybean meal and oil, primarily to China, India, and the European Union.
Discussion
Soybean production in Paraguay comprises a much smaller share of global production than in Brazil, the US, and Argentina. Limited domestic use results in a heavy relative reliance on export markets similar to that of Brazil. The majority of exports feed Argentina’s large crushing industry.
Limited opportunities for further acreage expansion suggest Paraguay will remain a relatively small producer with future production increases needing to be driven by continued yield growth. However, soybean production in Paraguay has been associated with high yield variability, resulting in large fluctuations in annual production. This variability, in combination with its dependence on exports means Paraguay can have a noticeable impact on the global soybean market.
References
Food and Agriculture Organization of the United Nations. (2024). FAOSTAT: Crops and livestock products. FAO. https://www.fao.org/faostat/en/#data/QCL
McGrath, C. (2026, April 15). Oilseeds and products annual — Paraguay (GAIN Report No. PA2026-0002). U.S. Department of Agriculture, Foreign Agricultural Service. https://www.fas.usda.gov/data/gain/2026/04/paraguay-oilseeds-and-products-annual
Disclaimer: We request all readers, electronic media and others follow our citation guidelines when re-posting articles from farmdoc daily. Guidelines are available here. The farmdoc daily website falls under University of Illinois copyright and intellectual property rights. For a detailed statement, please see the University of Illinois Copyright Information and Policies here.