


Agricultural Credit Conditions in Illinois – First Quarter 2026
Agricultural credit conditions in Illinois showed signs of strain in the first quarter of 2026. Although loan demand remained elevated, repayment rates deteriorated, and collateral requirements remained tight across the two Federal Reserve districts that serve the state. Average fixed interest rates on farm operating and real estate loans were lower than a year earlier, but the broader survey measures point to tighter credit conditions at the start of the year.
Today’s farmdoc daily article uses data from the Federal Reserve District Surveys of Agricultural Credit Conditions, which compiles quarterly responses from commercial banks within each participating Federal Reserve district. Because Illinois is served by two districts, our analysis only focuses on the Federal Reserve Bank of Chicago, which covers northern and central Illinois, and the Federal Reserve Bank of St. Louis, which covers southern Illinois.
Loan Demand Remained Elevated
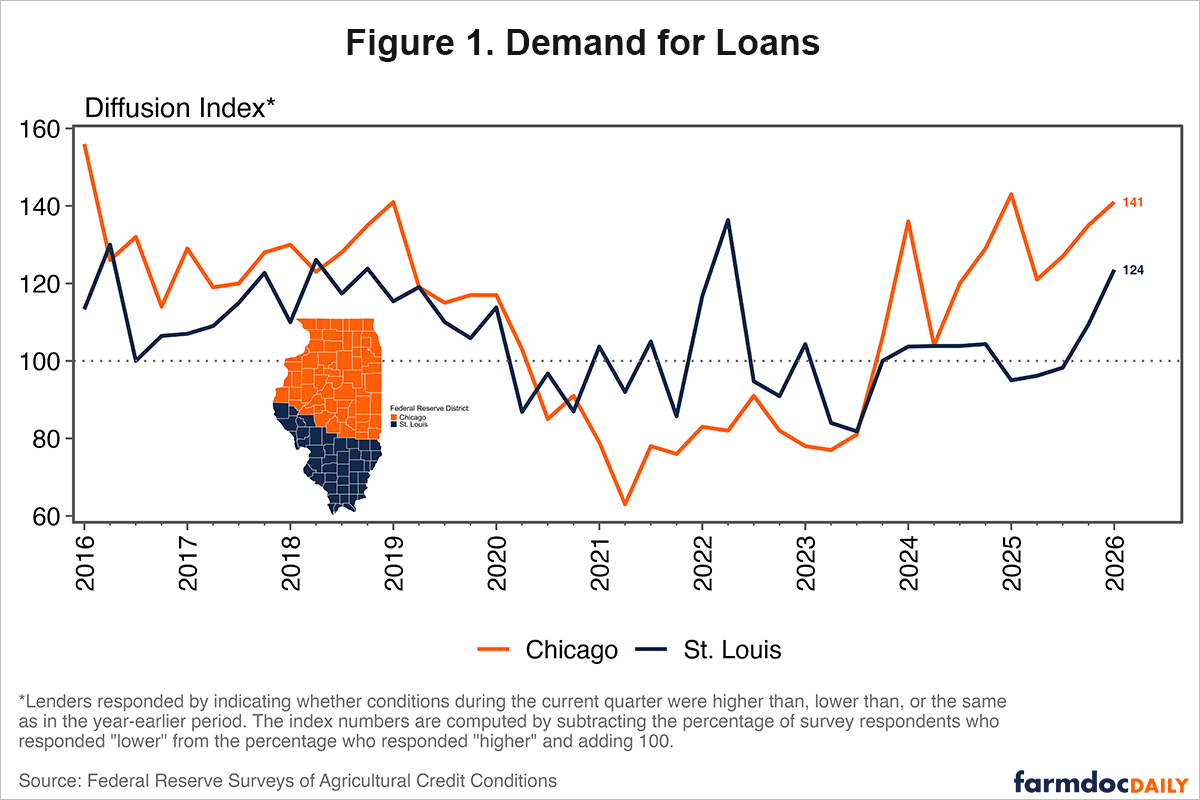
Figure 1 shows the diffusion indexes for loan demand. A value of 100 represents no change from the same quarter last year (neutral), with values above 100 indicating an increase, and values below 100 indicating a decrease.
Loan demand remained above 100 in both districts in the first quarter of 2026. In the Chicago district, the loan demand index was 141, slightly below 143 in the first quarter of 2025 but still well above 100. The latest reading continued the pattern of stronger loan demand observed in the district since late 2023.
The St. Louis district showed a larger year-over-year increase. Its loan demand index was 124 in the first quarter of 2026, up from 95 the same time last year. Overall, reports of stronger loan demand outnumbered reports of weaker demand in both districts in the first quarter.
Repayment Conditions Remained Weak
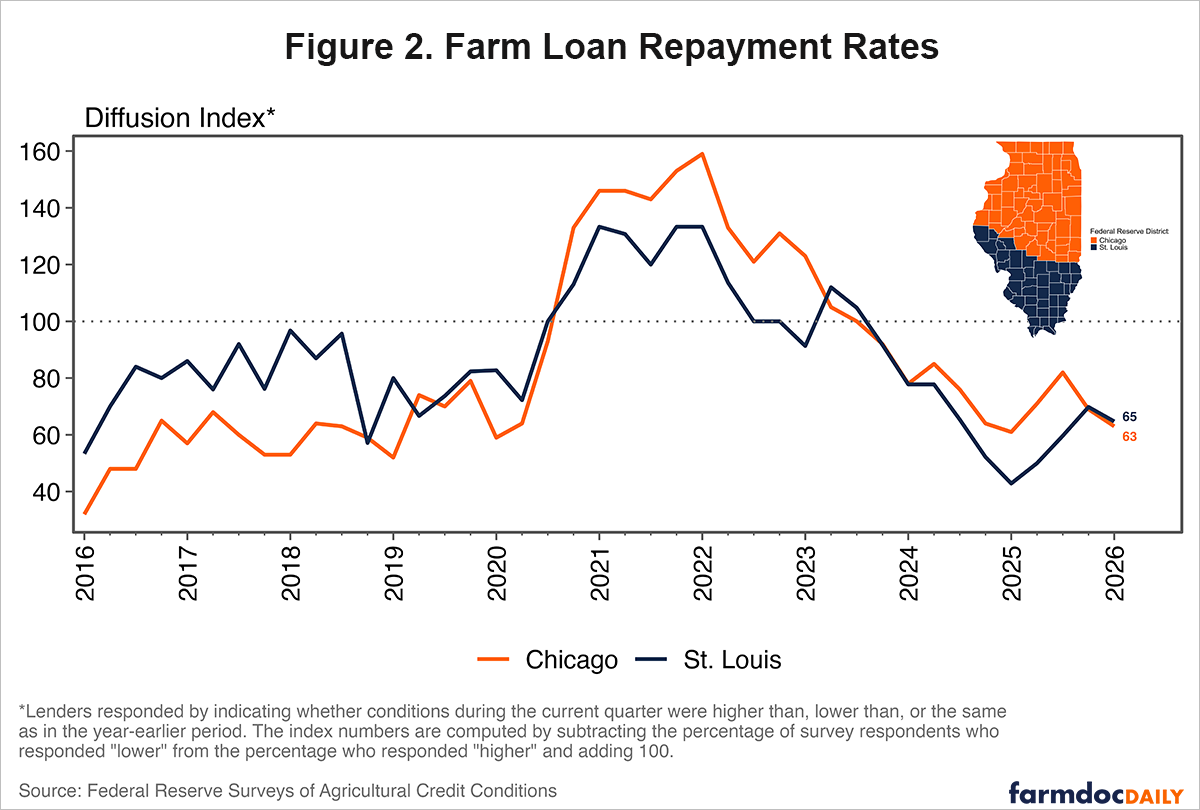
Figure 2 shows the diffusion index for farm loan repayment rates. The repayment indexes remained below 100 in both districts in the first quarter of 2026.
In the Chicago district, the repayment index was 63, slightly above 61 in the first quarter of 2025 but still well below 100. The latest reading indicates that reports of weaker repayment rates continued to outnumber reports of stronger repayment rates.
In the St. Louis district, the repayment index was 65 compared to 43 the same time last year. Reports of weaker repayment rates by bankers were less common than they were a year ago, but the index remained far below 100. Across both districts, the latest readings continued to point to weak repayment conditions.
Collateral Requirements Stayed Tight
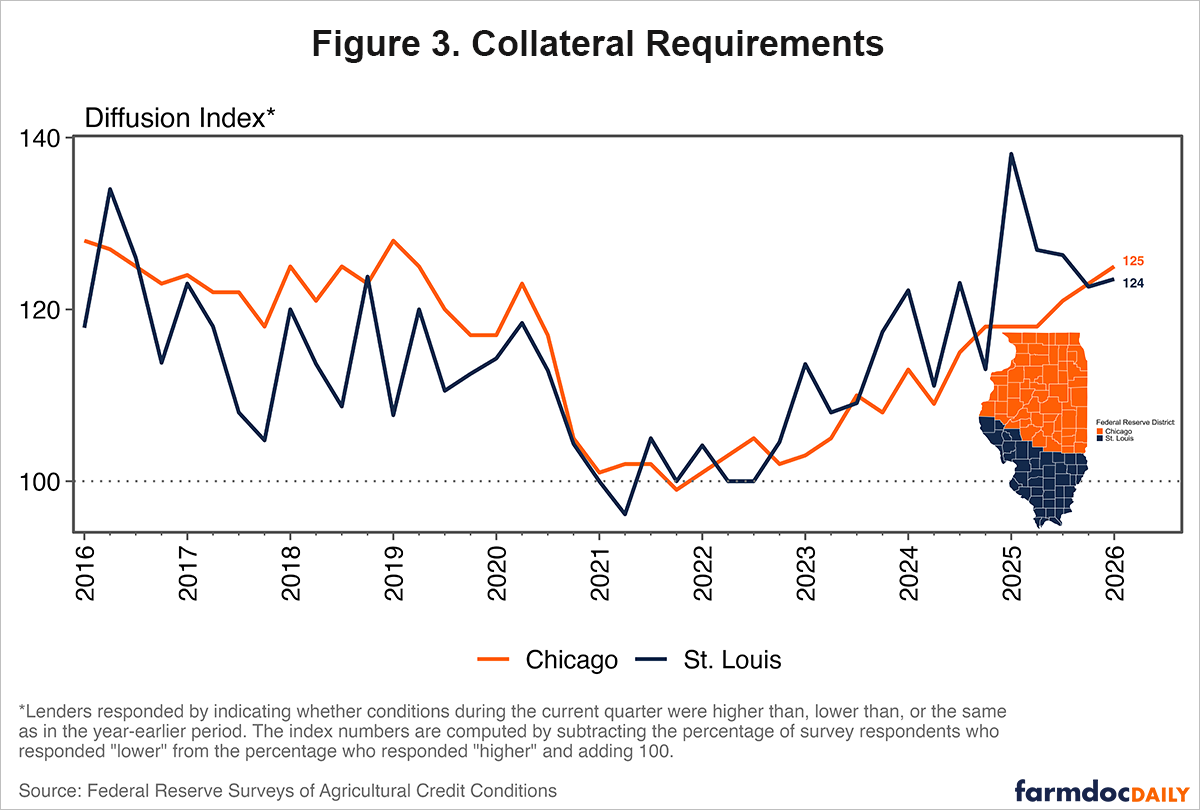
Figure 3 shows the diffusion index for collateral requirements. Collateral requirements remained well above 100 in both districts in the first quarter, showing continued tightening relative to the same quarter last year.
In the Chicago district, the collateral requirements index was 125, up from 118 in the first quarter of 2025. However, in the St. Louis district, the collateral requirements index was 124, compared to 138 a year earlier. The decline from last year indicates that reports of higher collateral requirements were less common than during the first quarter of 2025. Still, with the index above 100, reports of tighter collateral requirements continued to outnumber reports of easing requirements in the St. Louis district.
Fixed Operating Loan Rates Were Lower Than Last Year
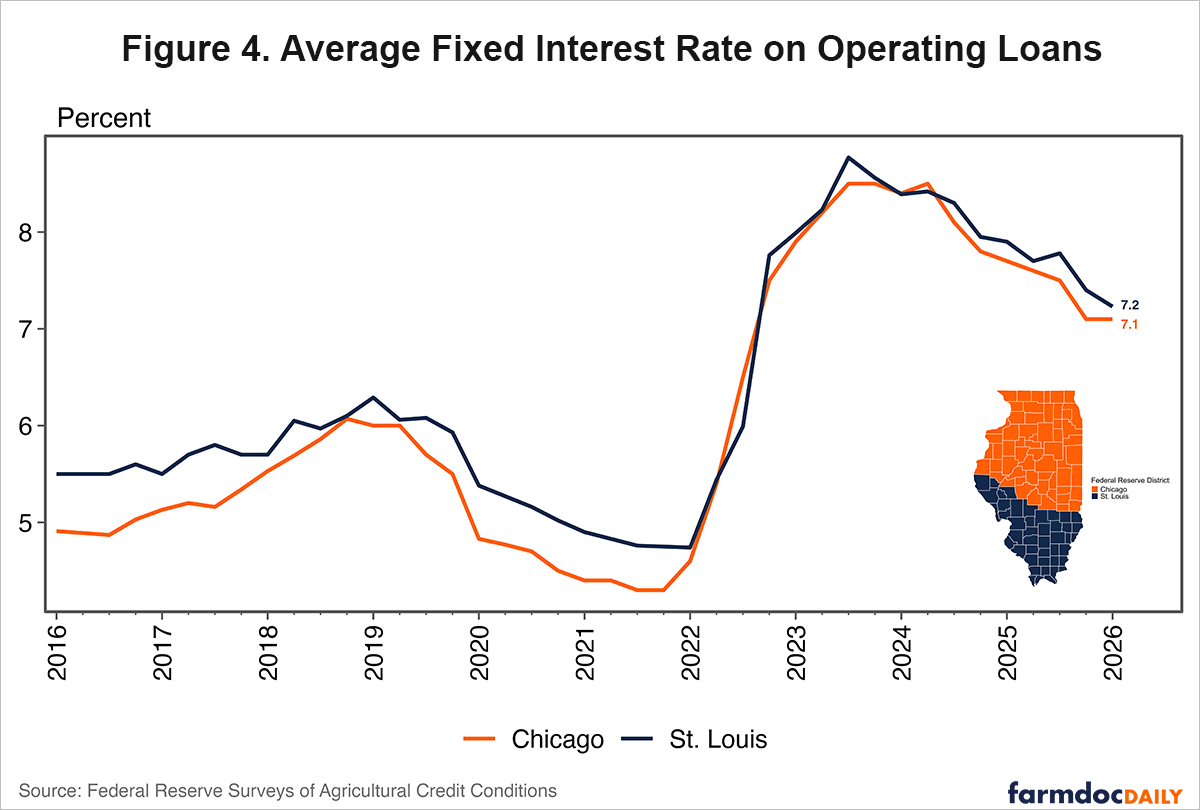
Average fixed interest rates on operating loans were lower than a year ago in both districts as shown in Figure 4. In the Chicago district, the average fixed rate was 7.1% in the first quarter of 2026. This was unchanged from the fourth quarter of 2025 and down from 7.7% in the first quarter of 2025.
The St. Louis district reported an average fixed operating loan rate of 7.2%, down from 7.4% in the previous quarter and 7.9% a year earlier. St. Louis continued to report a slightly higher fixed operating loan rate than Chicago, though the difference between the two districts was small in the latest survey.
Overall, both districts remained below their 2023 peaks. For example, fixed operating loan rates reached 8.5% in the Chicago district and 8.8% in the St. Louis district in the third quarter of 2023. Since then, rates have moved lower, though they remain above the levels reported in pre-COVID years.
Fixed Real Estate Loan Rates Also Declined
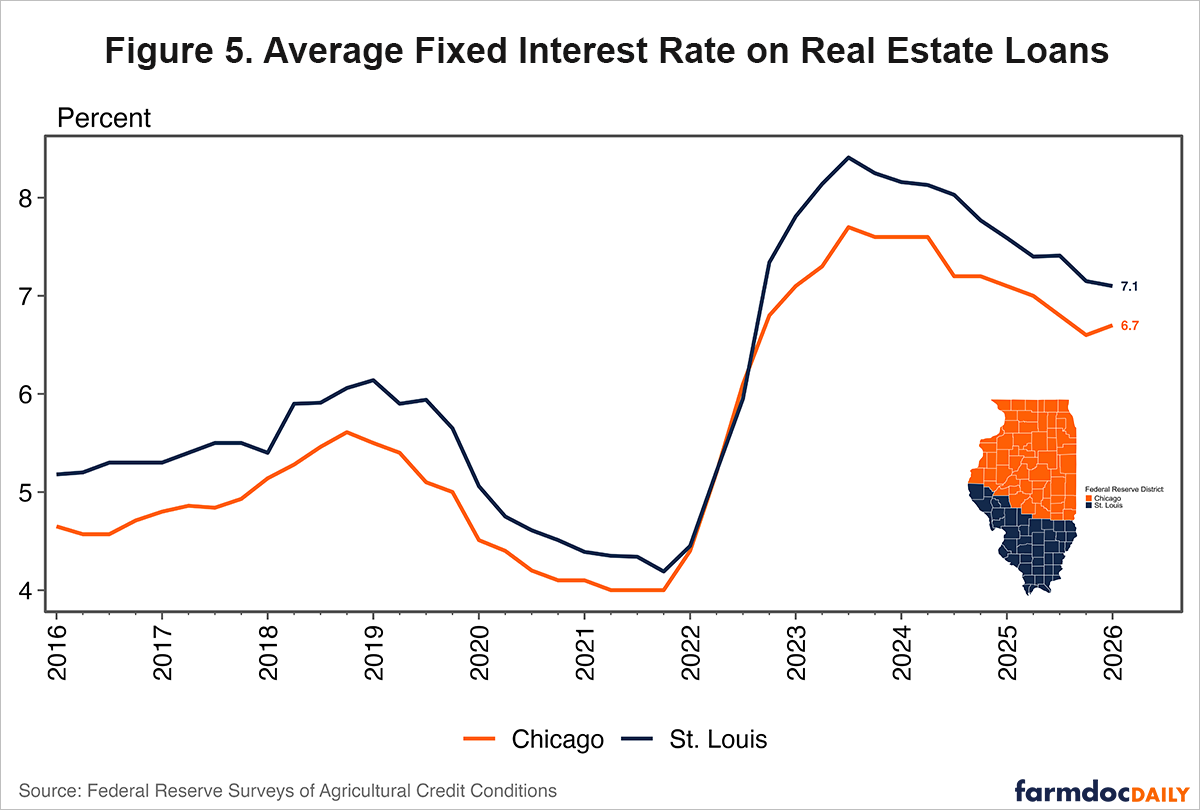
Average fixed interest rates on real estate loans followed a similar pattern to those on operating loans, as shown in Figure 5. In the Chicago district, the average fixed real estate loan rate was 6.7% in the first quarter of 2026, up slightly from 6.6% in the previous quarter but below 7.1% a year earlier. In the St. Louis district, the average fixed real estate loan rate was 7.1%, down from 7.2% in the fourth quarter of 2025 and 7.6% in the first quarter of 2025. As with operating loans, the St. Louis district continued to report higher rates compared to the Chicago district.
Summary
In summary, agricultural credit conditions in Illinois showed a gradual deterioration during the first quarter of 2026, mirroring broader national trends across the agricultural sector. Lenders in both the Chicago and St. Louis Federal Reserve districts reported that strong loan demand became more widespread compared to a year earlier. This reflects ongoing financing needs across a farm sector facing headwinds from elevated input costs. At the same time, repayment conditions remained soft and collateral requirements continued to tighten, indicating that agricultural lenders are maintaining stricter credit standards in response to tightening farm finances. Moreover, repayment rates have been weakest in districts heavily concentrated in crop production (see Federal Reserve Bank of Kansas City). Lastly, while average fixed interest rates on operating and real estate loans have declined from their 2023 peaks and sit lower than they did a year ago, borrowing costs remain historically elevated.
References
Kreitman, T. (2026, June 3). Continued resilience in farmland values. Agricultural Finance Update. Federal Reserve Bank of Kansas City. https://www.kansascityfed.org/agriculture/agfinance-updates/continued-resilience-in-farmland-values/
Disclaimer: We request all readers, electronic media and others follow our citation guidelines when re-posting articles from farmdoc daily. Guidelines are available here. The farmdoc daily website falls under University of Illinois copyright and intellectual property rights. For a detailed statement, please see the University of Illinois Copyright Information and Policies here.