








Tracking U.S. Food Supply Chains Through Recent Shocks– Part 1
Agri-food supply chains can be disrupted by more than production shocks. Transportation, trade, processing, labor, and demand can also affect how food moves. From 2018 to 2022, the United States experienced several overlapping shocks. These included the U.S.-China trade conflict, severe Midwest flooding in 2019, the COVID-19 pandemic, and drought in 2021 and 2022. These events provide an opportunity to examine how food movements changed across the national supply chain.
In our study, we used annual Freight Analysis Framework (FAF) data to track agri-food flows among U.S. regions. The analysis focuses on seven food-related Standard Classification of Transported Goods (SCTG) groups, listed in Table 1. We consider three types of flows: domestic shipments, exports, and imports.
Table 1. Food Commodity Groups Included in the Analysis
| SCTG Code | Food commodity group |
| 1 | Live animals and fish |
| 2 | Cereal grains |
| 3 | Other agricultural products |
| 4 | Animal feed and other animal products |
| 5 | Meat, poultry, fish, seafood, and related preparations |
| 6 | Milled grain and bakery products |
| 7 | Prepared foodstuffs, fats, and oils |
We use weighted node degree to represent regional connectivity, or how strongly each region is linked to the rest of the food system. This measure considers both how many other regions a region connects with and how much food moves through those connections. Here, we summarize three main findings from the analysis.
National Food Flow Trends
Figure 1 shows national agri-food flow volumes from 2017 through 2022 for domestic shipments, exports, and imports. Domestic food flows were fairly stable over the period, but two declines stand out: 2019 and 2022. The 2019 decline aligns with severe flooding across the Midwest, which delayed planting, damaged infrastructure, and disrupted transportation in major agricultural regions. The 2022 decline aligns more closely with drought, which affected a large share of the contiguous United States and reduced production conditions across the Plains and western states.
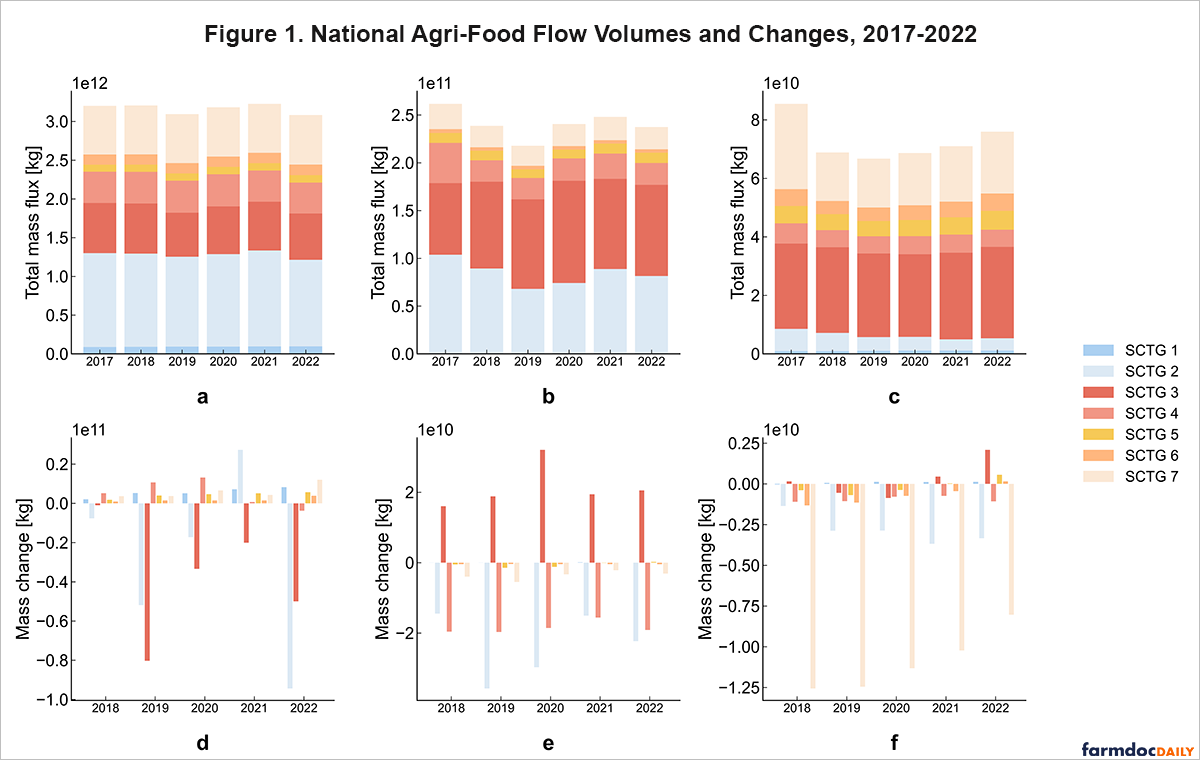
Domestic flows rebounded in 2020 and reached their highest level in 2021. This pattern suggests that food supply chains adjusted after the early months of the COVID-19 pandemic. As consumer demand shifted, restaurants reopened, and distributors reworked logistics, domestic food movement recovered even though the broader pandemic had not fully ended.
Export flows require a separate interpretation. Figure 1 shows that total export volume was lowest in 2019, when trade tensions overlapped with severe Midwest flooding. This pattern differs from domestic flows because export volumes also reflect changes in buyers, prices, and trade routes.
The 2018 trade-war effect was more complicated than a simple drop in shipments. Agricultural products (SCTG 3) exports rose even as tariffs disrupted trade with China because some shipments were redirected to other international buyers. However, the data shows that total trade value for these products declined in 2018. In other words, stable or rising export volumes do not necessarily mean that producers received the same economic returns.
Imports show a different pattern. Import volumes declined from 2017 through 2019 and then recovered after 2020. Stronger consumer demand, improving global logistics, and continued agricultural trade with neighboring countries all likely contributed to this recovery. Border regions, especially those connected to Mexico, remained important entry points for fruits, vegetables, and other food products.
Regional Differences in Food Flow Changes
Figure 2 shows the largest percentage changes in agri-food flows across U.S. regions between 2018 and 2022, including domestic inflows, domestic outflows, exports, and imports.
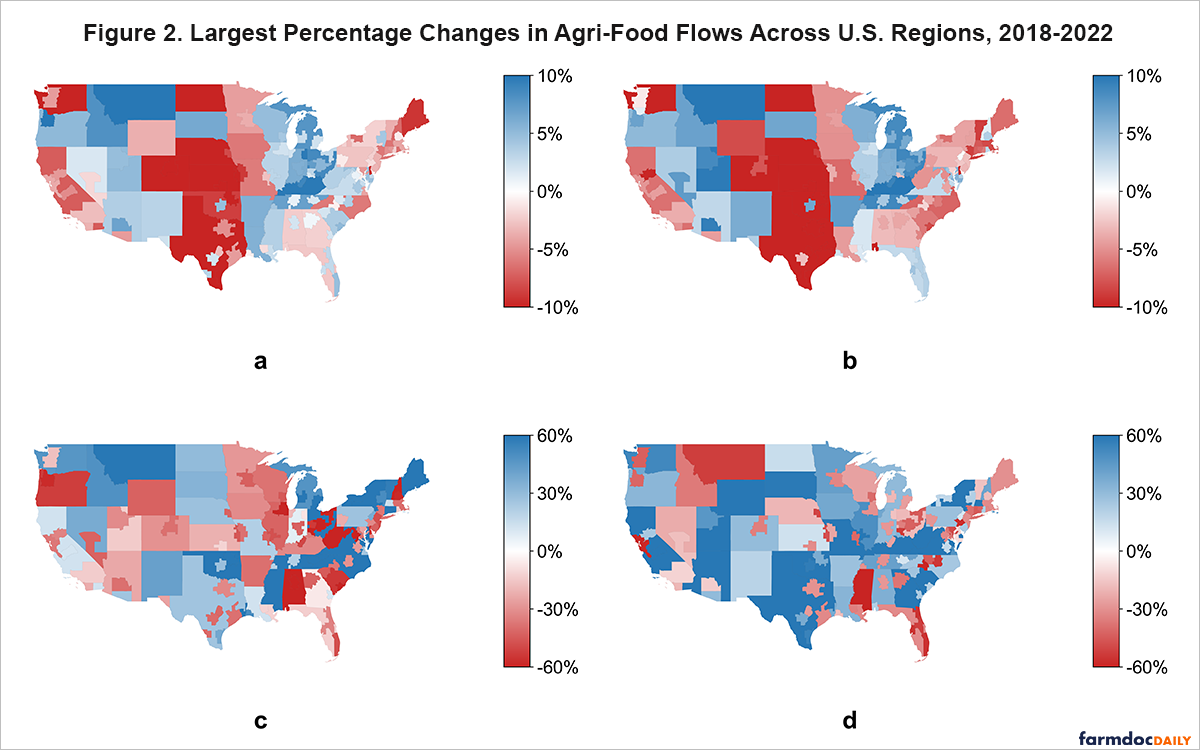
Several Midwestern and Plains regions appear repeatedly among the largest changes. In 2019, Iowa experienced large declines in domestic outflows, consistent with the effects of spring flooding on planting, farm-to-market movement, and transportation infrastructure. In 2020, pandemic-related disruptions were more visible in selected commodity systems. Montana livestock flows were affected by meatpacking disruptions, while Idaho potato flows reflected the sharp reduction in restaurant and food service demand.
Drought became more important in 2021 and 2022. Central and Northern Plains states, including Iowa, Nebraska, and South Dakota, experienced reductions in domestic outflows in 2021. By 2022, drought-related declines were visible across parts of Nebraska, Kansas, Oklahoma, Colorado, and Texas. These regions are central to crop and livestock production, so weather-related production stress can quickly show up in domestic food movement.
Import patterns were different. Southwestern states and other border-connected regions saw increases in imported agricultural products, reflecting both consumer demand for fresh products and the importance of land transportation from Mexico. In some cases, reduced domestic supply due to weather events may have increased the role of imports in meeting food demand.
Regional Resilience
Changes in food flow volumes provide only part of the resilience picture. A region may move less food during a shock but still maintain a broad set of trading connections. Conversely, a region may remain dependent on a smaller set of routes or partners. Figure 3 compares changes in inflow and outflow weighted node degree across regions.
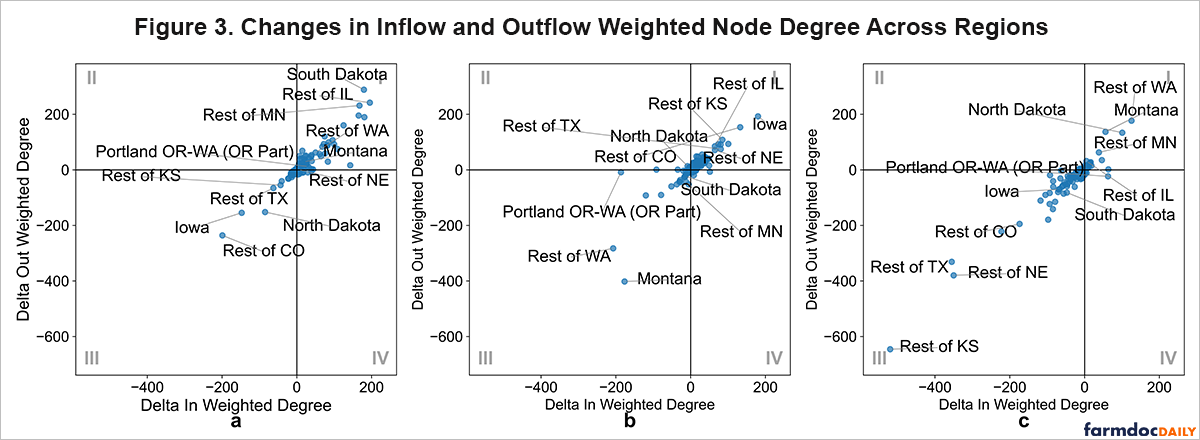
Agricultural production regions generally recovered more quickly than many urban logistics centers. Several regions in Iowa, Kansas, Illinois, Nebraska, and Colorado moved from reduced connectivity during a shock toward renewed or stronger connectivity in subsequent years. These patterns suggest that some production regions were able to regain food movement as weather conditions improved, harvest cycles resumed, or commodity demand returned.
Urban and coastal logistics hubs often recovered more slowly. Regions around New York, Los Angeles, Boston, Portland, and parts of Washington showed more persistent disruption in some food categories. These areas depend on a complex combination of transportation services, warehouse capacity, processing, labor availability, imports, and consumer demand. Disruptions in any one of those components can slow recovery.
The contrast between production regions and logistics hubs is useful for interpreting supply chain resilience. Resilience does not depend only on whether a place produces food. It also depends on the role the region plays in the broader network and whether the disruption is related to weather, infrastructure, markets, or policy.
Implications
These findings point to several implications. First, resilience is regional. The same national shock can have very different effects depending on local commodities, transportation access, infrastructure, and trading relationships. A strategy that works for a grain-producing region may not address the vulnerabilities of an urban logistics hub.
Second, transportation flexibility matters. Regions with multiple trading partners, routes, or modes may be better positioned to adjust when a flood, drought, port disruption, or policy shock interrupts normal movement. Investments that improve routing flexibility at major hubs and along key corridors could help reduce the impact of future disruptions.
Third, specialized commodity regions may need more capacity to absorb shocks. Regions that depend heavily on one commodity or one demand channel can be exposed when that channel changes quickly, as occurred for food service demand during the pandemic. Storage, processing flexibility, and alternative buyers can help reduce that exposure.
Finally, the results should be interpreted with the limits of annual freight data in mind. Annual FAF data are useful for identifying broad changes in agri-food movement, but they can mask short-term disruptions within a planting, harvest, or shipping season. Multiple shocks also overlapped during the study period, making it difficult to link every observed change to a single cause.
Overall, the 2018-2022 experience shows that U.S. food supply chains are adaptable, but recovery is not uniform. National food flows generally rebounded after major shocks, while the location and speed of recovery varied widely across regions. Identifying these differences can help decision-makers strengthen transportation infrastructure, diversify supply routes, and improve the resilience of U.S. agri-food supply chains under future shocks.
References
Zhang, R., A. Arnav, D. B. Karakoc, and M. Konar. 2026. "Compound Shocks to Agri-Food Supply Chain Transport and Trade in the United States." Frontiers in Sustainable Food Systems 9: 1661492. https://doi.org/10.3389/fsufs.2025.1661492
Disclaimer: We request all readers, electronic media and others follow our citation guidelines when re-posting articles from farmdoc daily. Guidelines are available here. The farmdoc daily website falls under University of Illinois copyright and intellectual property rights. For a detailed statement, please see the University of Illinois Copyright Information and Policies here.