








Tracking U.S. Food Supply Chains Through Recent Shocks – Part 2
The domestic US food supply chain is vital in connecting farms, businesses, and consumers across the country and beyond. Events such as pandemics, trade disputes, floods, and droughts can disrupt these connections in different ways from one location to another. It is therefore important to study a high-resolution county-level impact of shocks on the US supply chain. Understanding these impacts helps identify vulnerable areas, improve resilience of transportation and food systems, protect critical infrastructure, and support policies that strengthen food security and sustainability.
We study the impact of overlapping disruptions that occurred in 2018-2022 on county-level agrifood flows. These disruptions included the US-China trade war (2018-2020), the Midwest floods (2019), the pandemic (2020), and the North American drought (2021-2022). Using the Food Flow Model, we downscale the Freight Analysis Framework (FAF) level agrifood flows to county-level. More details about the downscaling process can be found in our publication. It is important to note that the county-level agrifood flows are estimated and should not be interpreted as a direct representation of ground truth movements. Rather, the Food Flow Model provides a useful way to understand broad patterns and changes in county-level food flows at an annual scale. As a result, short-term fluctuations and transient disruptions in food movements may be obscured within the annual estimates.
Major Changes in County-level Food Flow Trends
The periods leading to the highest % changes in agrifood flows differed regionally, suggesting that certain periods strongly affected specific regions (Figure 2). However, the magnitude of these changes varied widely between counties within the same region. For all commodities (Figures 1(H) and 2(H)), 2021–22 led to the highest decreases in Nebraska and Kansas, but even within these regions, the magnitude of change varied from as little as 0–5% to nearly 100%!
Furthermore, during the same period (2021–22), the highest increments occurred in counties within other states such as Florida, Nevada, and New Mexico. This highlights that the period which was beneficial to some regions could be detrimental to others.
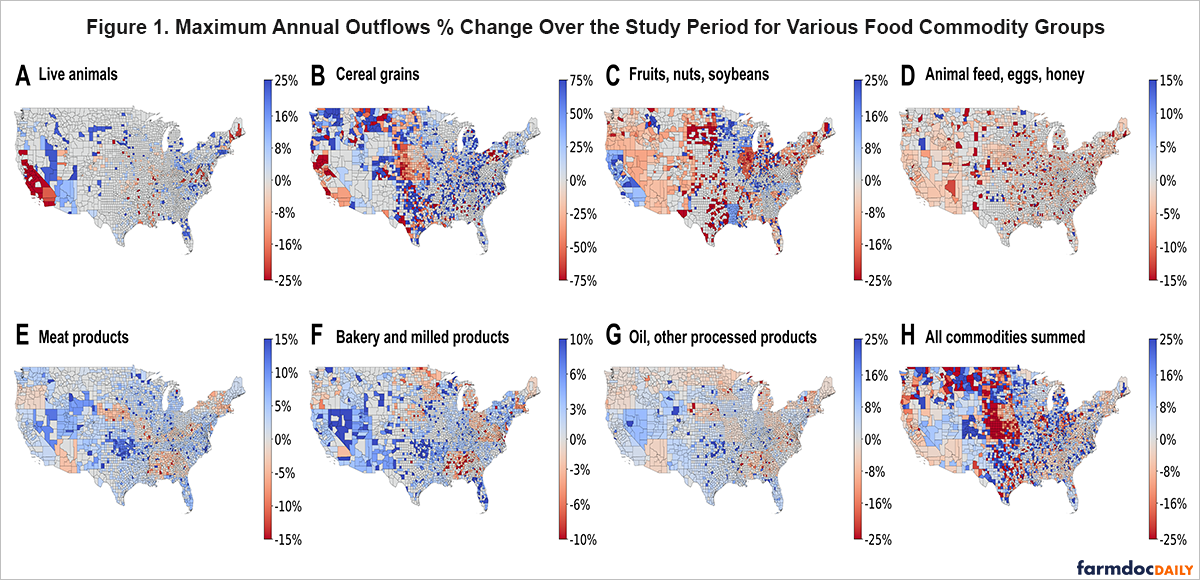
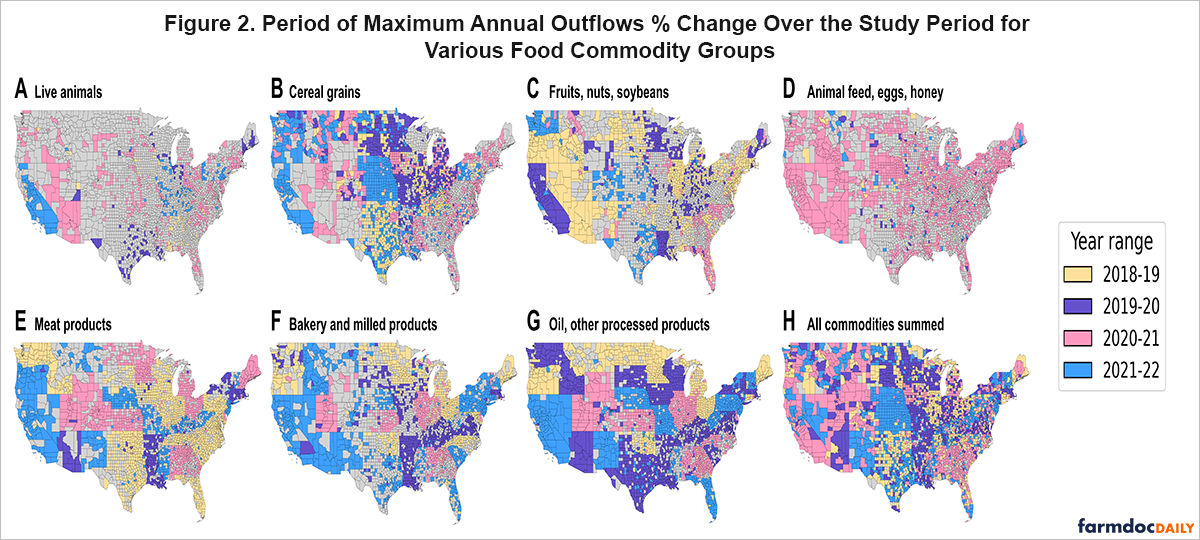
2018–19 marked the beginning of the trade war between the US and China, which impacted the trade and production of soybeans ultimately decreasing the outflows of agricultural commodities including soybean (Figure 1(C)). However, the trade war did not affect other agricultural products such as fruits and vegetables. Hence, the outflows for Florida (Figure 1(C)), a major producer of citrus fruits, increased during the same period while the soybeans-producing regions suffered.
2019-20, on the other hand, was a generally beneficial period across the country except for some states such as Virginia, Arizona, and New York. The year 2020 marked the beginning of COVID-19, the signing of the trade agreement between US-China, and recovery from the 2019 Midwest floods. Although COVID-19 affected local food demand/supply, regional variations on an annual scale were not very prominent, leading to mostly increments in flows during this period.
2020–21 led to overall decreases in agricultural commodities (Figures 1(B), (C) and 2(B), (C)) but was moderately incremental for processed food products (Figures 1(E), (F), (G) and 2(E), (F), (G)). The decreases in agricultural commodities likely occurred due to the onset of drought that had originated in the West and engulfed more than 40% of the US by July, 2021. Due to worsening and lasting drought conditions in 2022, the period 2021-22 was broadly detrimental to crops but observed a steady progression in processed food products.
On the other hand, 2019–20 was mostly an incremental period across the country for various agri-food commodities except for some states such as Virginia, Arizona, and New York. The year 2020 marked the beginning of COVID-19, the signing of the trade agreement between US-China, and recovery from the 2019 Midwest floods. Although COVID-19 affected local food demand/supply, regional variations on an annual scale were not very prominent, leading to mostly increases during this period. The period 2020–21 led to overall decrements in the outflows of agricultural commodities but was moderately incremental for processed commodities.
Role of Inflows Diversity in Mitigating Supply Disruptions
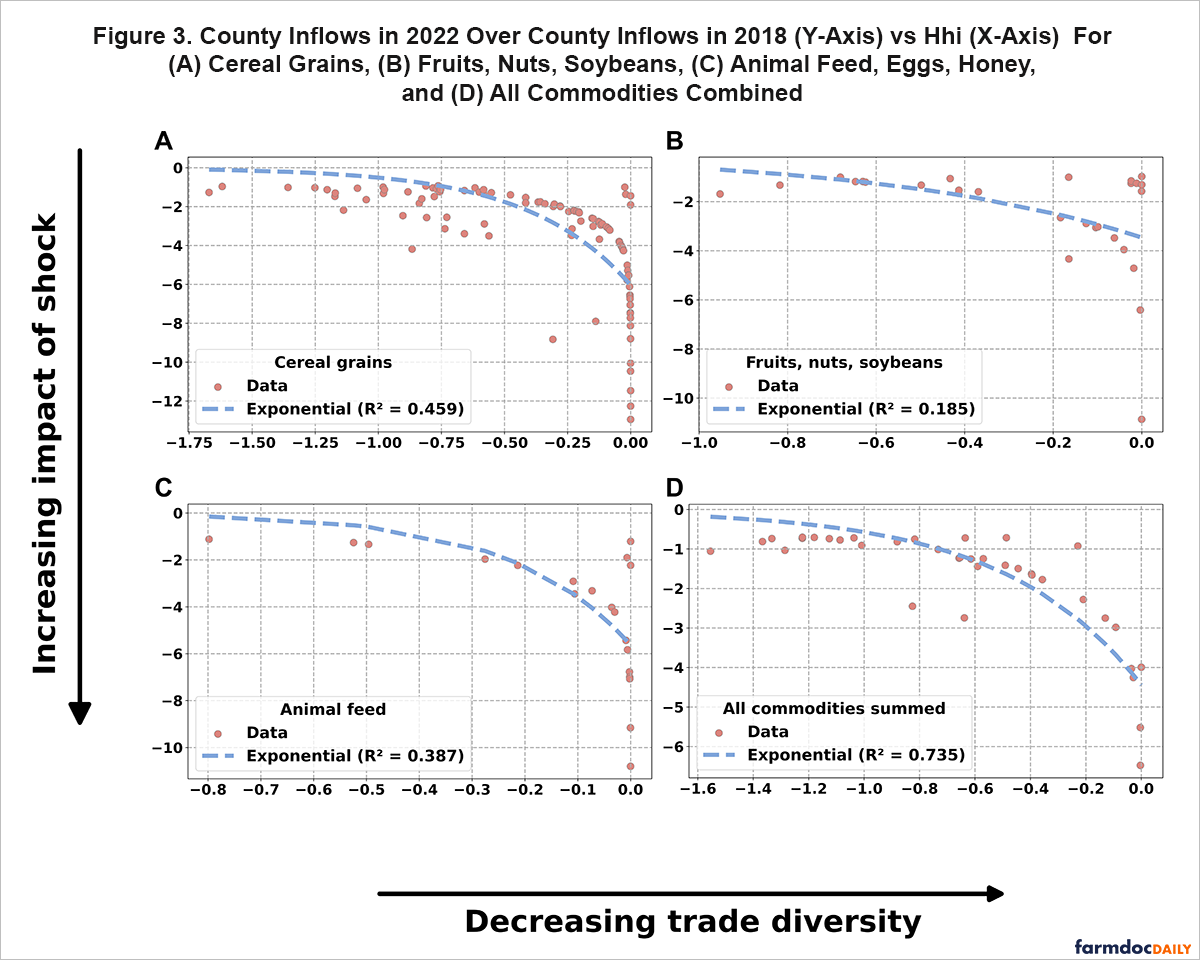
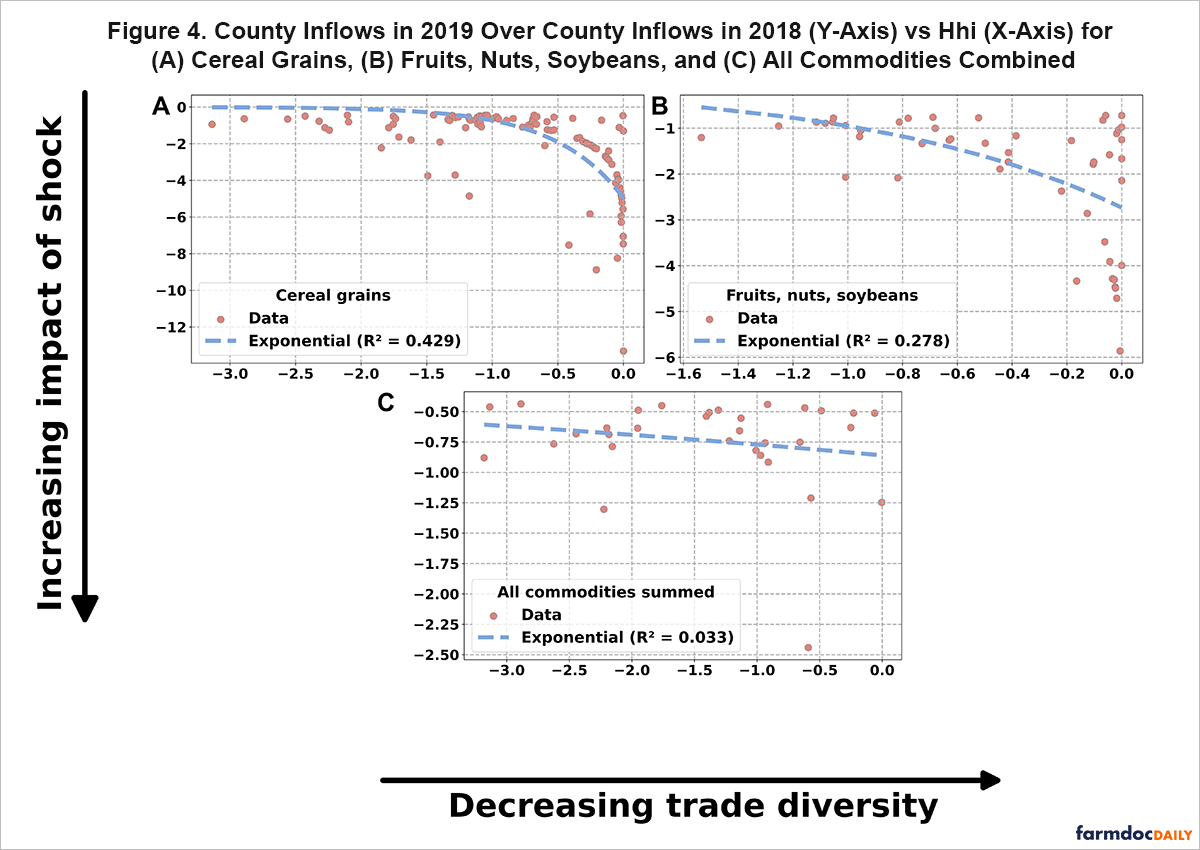
Since 2019 was a major flood year in the Midwest and 2022 was a prominent drought year, we study the trend of change in county inflows with domestic trade diversity for these two years in Figures 3 and 4, respectively.
During flood and drought years, there is a rapid decline in county inflows with decreasing inflows diversity. These counties rely on only a few suppliers and are highly susceptible to reductions in inflows during disruptions. Furthermore, several of these are rural counties that do not have many options for agrifood sourcing. They therefore have no other option but suffer a cut in supply when a disruption affects their supply chain.
On the other hand, counties that rely on several other counties to procure agrifood commodities and therefore have high domestic trade diversity do not experience significant changes in their inflows. Since these counties have many suppliers, even when some of them are affected by disruptions, others remain functional and cover small losses. This finding highlights that diversity in county inflows safeguards against unforeseen losses in supply during shocks.
Implications
Disruption is associated with changes in agrifood flows between counties, but these changes manifest differently across the categories of commodities included in the study. Each food group responds differently to a given disruption. During a particular period, increases in flows for a specific commodity did not mean that the period was incremental for other commodities as well. In fact, some commodities faced significant decreases in flows during the same period. The spatial variation in how different commodities respond to disruptions highlights the need for locally tailored strategies to assess risks and build adaptive capacity.
Diversity in inflows acts as a consistent buffer against disruption-related losses. Counties having diversified inflows experienced smaller reductions in agrifood inflows during shocks. More diverse inflows portfolios reduce dependency on specific suppliers and thereby enhance system-level resilience. Policies tailored towards diversification of local inflows, especially in rural areas, can safeguard against supply disruptions.
References
Arnav, A., Zhang, R., Karakoc, D. B., & Konar, M. (2026). Shocks to agri-food flows between counties in the United States from 2018 to 2022. Environmental Research: Food Systems, 3(1), Article 011002. https://doi.org/10.1088/2976-601X/ae487c
Disclaimer: We request all readers, electronic media and others follow our citation guidelines when re-posting articles from farmdoc daily. Guidelines are available here. The farmdoc daily website falls under University of Illinois copyright and intellectual property rights. For a detailed statement, please see the University of Illinois Copyright Information and Policies here.