








Which FSA Farm Loan Borrowers Filed Bankruptcy between 2015-2025?
U.S. farm bankruptcy filings rose in both 2024 and 2025, reversing a trend that had been improving since a peak in 2019. Prior years of falling crop prices, higher interest rates and input costs, rising land prices and rental rates, and stress specific to certain crops and livestock sectors have all contributed to the recent increase in bankruptcy filings. These impacts have been slightly tempered by government efforts to stabilize farm income as well as FSA loan policy.
Bankruptcy is what economists call a “lagging indicator” (AFBF, 2026). By the time a farm files, it has usually already been under financial stress for a while and has exhausted other options, such as refinancing or selling assets. This article provides a snapshot of borrowers participating in the USDA’s Farm Service Agency (FSA) loan programs who filed for bankruptcy between 2015-2025 by state, region, or crop and livestock type.
FSA Direct and Guaranteed Loan Programs
The Farm Service Agency provides farm credit in the form of loans through two primary programs: direct and guaranteed loans. Direct loans are funded through annual Congressional appropriations and are made, and serviced, directly by FSA. These loans serve producers who cannot obtain commercial credit elsewhere on reasonable terms.
Guaranteed loans are originated and serviced by outside lenders including commercial banks, the Farm Credit System institution, or credit unions. FSA guarantees up to 95 percent of the lender’s potential loss due to borrower default. The lender, not the farmer, is FSA’s direct customer in this arrangement. Guaranteed loan customers tend to be larger operations and the loans themselves are subject to a larger loan limit ceiling — currently $2,343,000 (USDA, 2026).
Types of Bankruptcy Filings
Unlike other analyses, which look mainly at Chapter 12 bankruptcy and use this as a proxy for agricultural bankruptcy filings this study covers bankruptcy under all chapters, provided the borrower was a current FSA direct or guaranteed loan customer. The data provides a breakdown of bankruptcy type for guaranteed borrowers only. The bulk of guaranteed loan borrowers (87 percent) took advantage of Chapter 12 bankruptcy. This was followed by Chapter 13 (8.3 percent), Chapter 11 (3 percent), and Chapter 7 (1 percent). For additional information on U.S. farm bankruptcy chapters refer to the articles by the Administrative Office of the U.S. Courts (2026) and National Agricultural Law Center (2026) in the additional resources section.
Filings by Year
Roughly 2,900 direct loan borrowers and 157 guaranteed loan borrowers filed bankruptcy during the 2015-2025 timespan. The difference in bankruptcy filings between the two programs is due to multiple factors, including the larger size of the direct loan program and differences in participant composition and administration. Firstly, direct loan borrowers tend to on average be riskier borrowers in general, given they are unable to qualify for commercial credit even with the FSA guarantee. Secondly, because direct loans are funded and serviced by FSA directly, they are the main lender of record. When the borrower declares bankruptcy, they are required to halt any collection efforts and take other measures. In contrast, within the guaranteed loan program, FSA finds out about a borrower’s bankruptcy only if the private lender reports it, leading to a potential under-reporting of the true number of guaranteed loan borrowers filing bankruptcy.
The annual patterns for direct and guaranteed loans diverged somewhat. Direct loan bankruptcies climbed steadily from 2016 through a peak in 2019 (632 filings), then fell sharply in 2020 (Figure 1). They began to slowly rise again in 2023 (Figure 1). Guaranteed loan bankruptcies rose from 2016 to a peak in 2018 (22 filings), then declined more gradually through 2024 before ticking back up in 2025 (Figure 2).
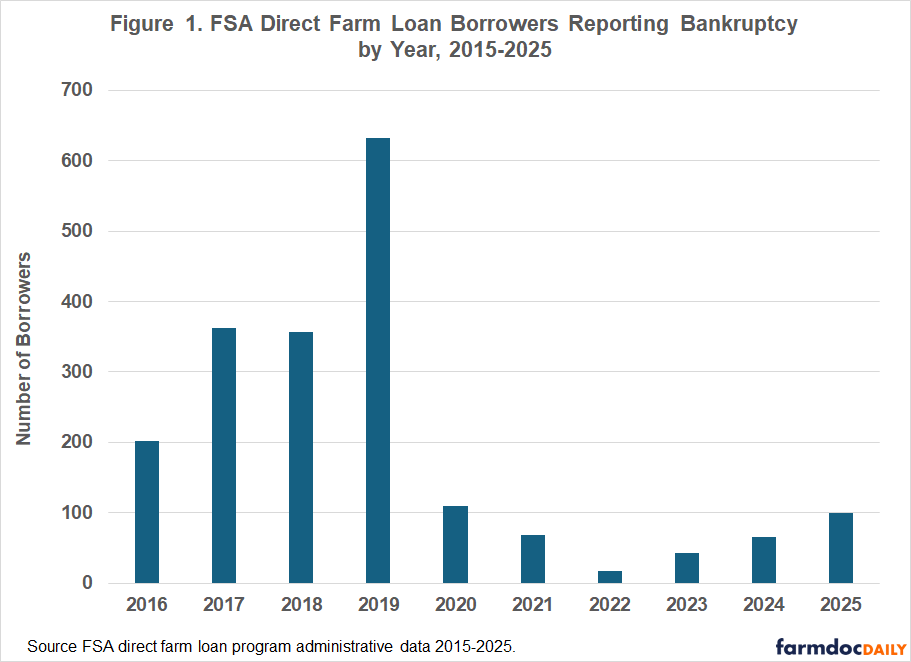
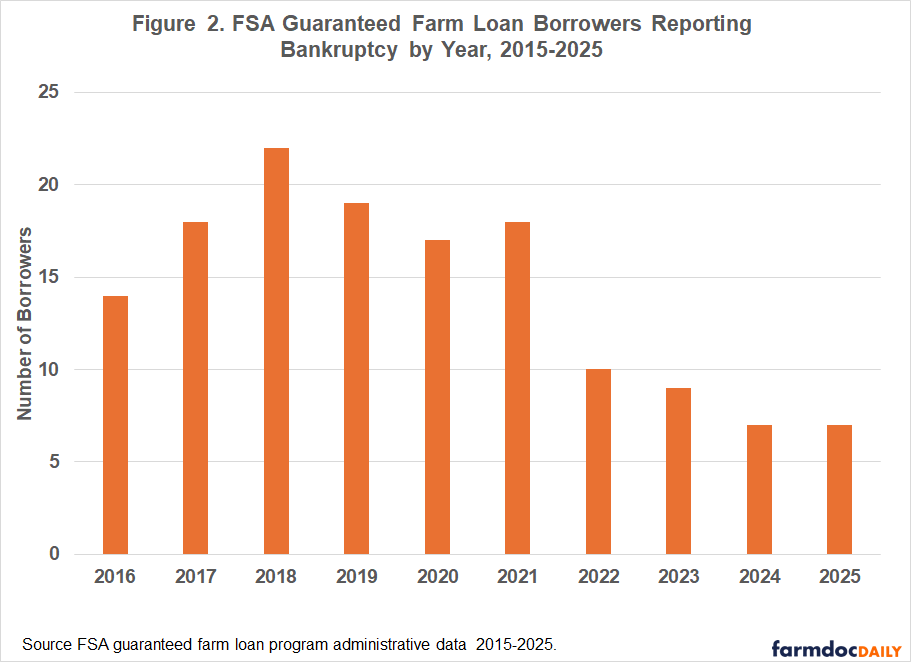
This “more moderate” trend for guaranteed compared to direct loan borrowers is likely due to the fact guaranteed loan borrowers tend to be larger operations on average, would be more likely to be more diversified, may have been less exposed to the swings in specific commodity prices during 2016–2020, and/or may have received a greater share of overall government assistance during those years. On the other hand, they would have benefited less from FSA specific direct-loan-focused federal assistance during those years.
Yearly trends show a strong link between bankruptcy filings and prior year’s movements in farm income. Prices for commodities such as soybean, corn, and wheat fell substantially between 2011 and 2016. The conditions in agriculture worsened further in 2018 and 2019 as retaliatory tariffs cut into export markets. By 2019, U.S. farm sector debt had reached a record level and farm bankruptcy filings nationally hit their highest point since 2011. The drop in bankruptcy filing rates in 2020 coincided with a rebound in commodity prices in 2021 and 2022 and government program payments, which pushed net farm income to a record high in 2022. Unfortunately, crop prices softened again in 2023 through 2025 as crop cash receipts fell toward their lowest levels in nearly two decades. This happened as production costs stayed elevated, putting stress on farm margins, coinciding with an uptick in filings in 2024 and 2025.
Some degree of these farm income impacts were cushioned by government payments and FSA loan measures. In addition, FSA debt relief and set-aside assistance delivered between 2022 and 2024 reduced outstanding direct borrower debt and likely contributed to the low level of filing during the period before 2024.
Regional Patterns
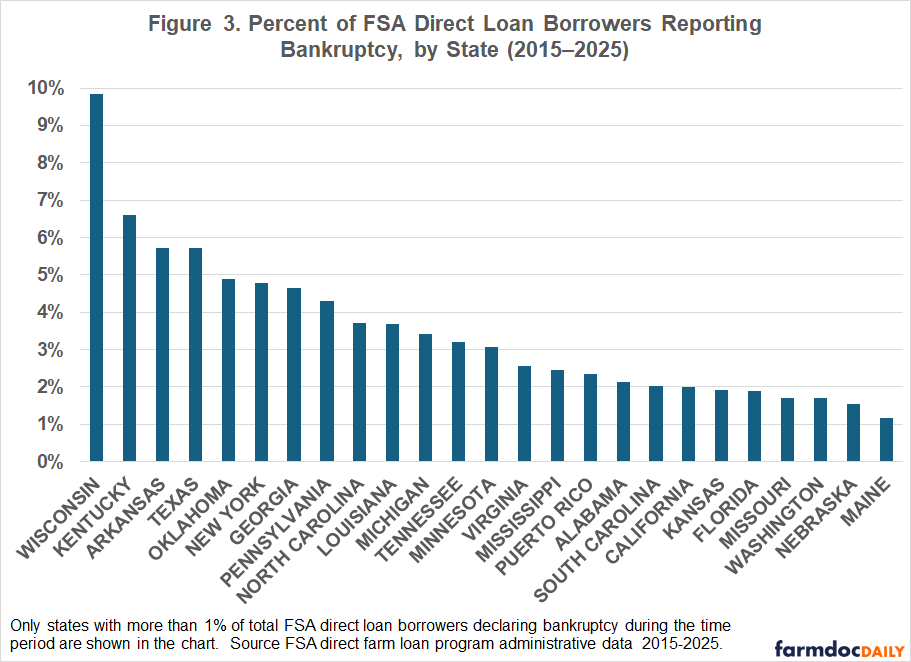
For direct loan borrowers, bankruptcy filings were heavily concentrated in a handful of states. Wisconsin led the list, accounting for nearly 10 percent of all filers, followed by Kentucky (6.6 percent), Arkansas (5.7 percent), and Texas (5.7 percent). Followed by Oklahoma (4.9 percent), New York (4.8 percent), Georgia (4.7 percent), Pennsylvania (4.3 percent), North Carolina (3.7 percent), and Louisiana (3.7 percent) (Figure 3).
Guaranteed loan borrowers showed an even more concentrated pattern. Wisconsin again topped the list, with nearly a quarter of all guaranteed loan bankruptcy filers (24.5 percent). Minnesota (10.8 percent), Georgia (9.5 percent), and Kansas (9.5 percent) followed, with smaller shares in Texas (5.8 percent), Pennsylvania (4.5 percent), and Arizona (4.2 percent) (Figure 4).
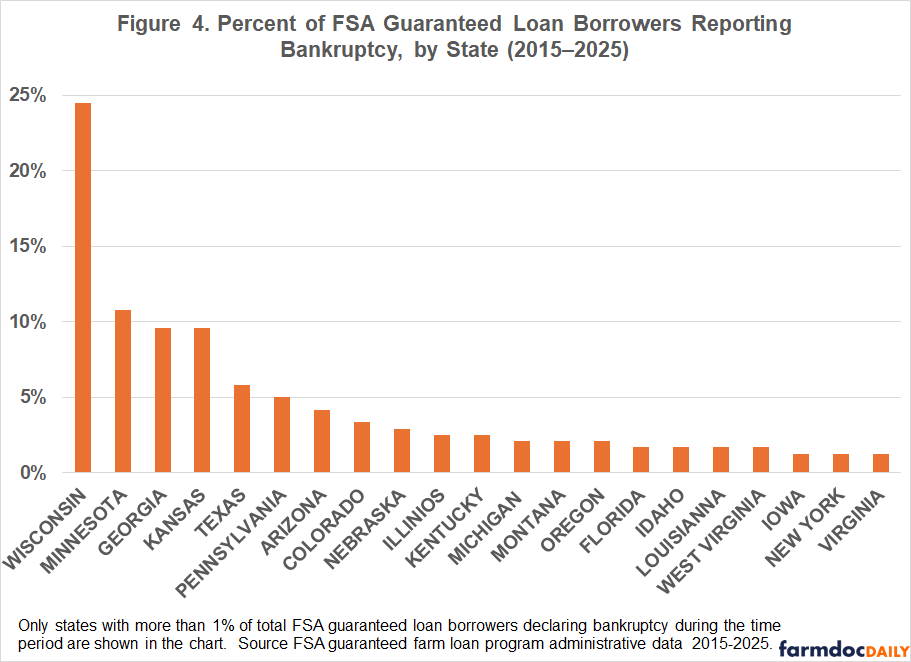
The large share of bankruptcies reported by borrowers in Wisconsin is linked to its heavy reliance on dairy farming. Dairy producers have experienced rising interest rates, depressed commodity prices, and rising equipment, labor, and fuel costs against falling milk prices over the past decade. These pressures have been linked to the widespread consolidation of dairy farms in Wisconsin. Smaller operations have been hit harder, as well as areas with higher land prices.
Southern states had a significantly large footprint in filings. For example, in Arkansas bankruptcies surged during this period, with the state leading the nation in Chapter 12 filings in 2025. Arkansas produces a significant amount of U.S. rice, which has suffered severe losses recently. Because of this, rice farmers are expected to lose money on every acre planted, even after supplemental assistance in 2025 (AFBF, 2026). In addition, crop losses across other row crop commodities in these states due to declining receipts and rising expenses also contributed to the increase in filings.
High filings in Midwest states such as Minnesota, Kansas, and Georgia for guaranteed loan borrowers can be linked to weakening dairy, hog, and poultry markets during segments of this time period as well as the most recent row crop losses (AFBF, 2026).
Commodity Specific Patterns
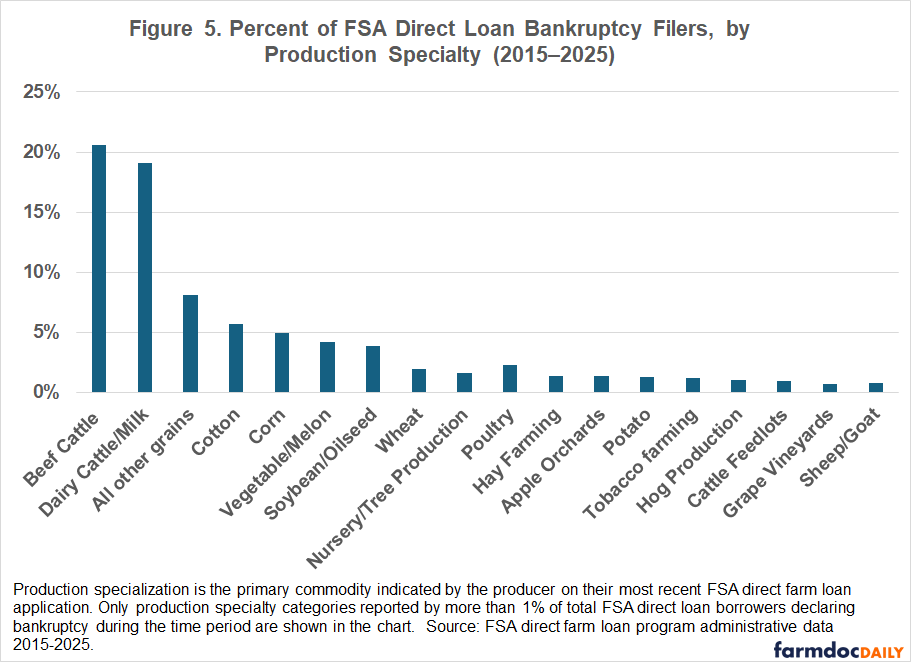
The types of farming operations most likely to end up in bankruptcy differed somewhat between the two loan programs, but with clear overlap. Among direct loan borrowers, beef cattle ranching and dairy/milk production were by far the most common specialties, each representing about one-fifth of all filers (20.1 percent apiece). Other grain farming (8.8 percent), miscellaneous crops (7.3 percent), cotton (5.9 percent), corn (5.4 percent), and vegetable or melon farming (4.3 percent) also were reported by a significant share of filers (Figure 5).
Among guaranteed loan borrowers, dairy operations again stood out, with dairy and milk production together accounting for roughly a quarter of filers (14.6 percent and 12.1 percent, respectively). Corn (10.5 percent), soybeans (8.4 percent), cotton (7.1 percent), beef cattle (6.3 percent), poultry (4.2 percent), and other grain farming (3.8 percent) producers made up much of the remaining share (Figure 6).
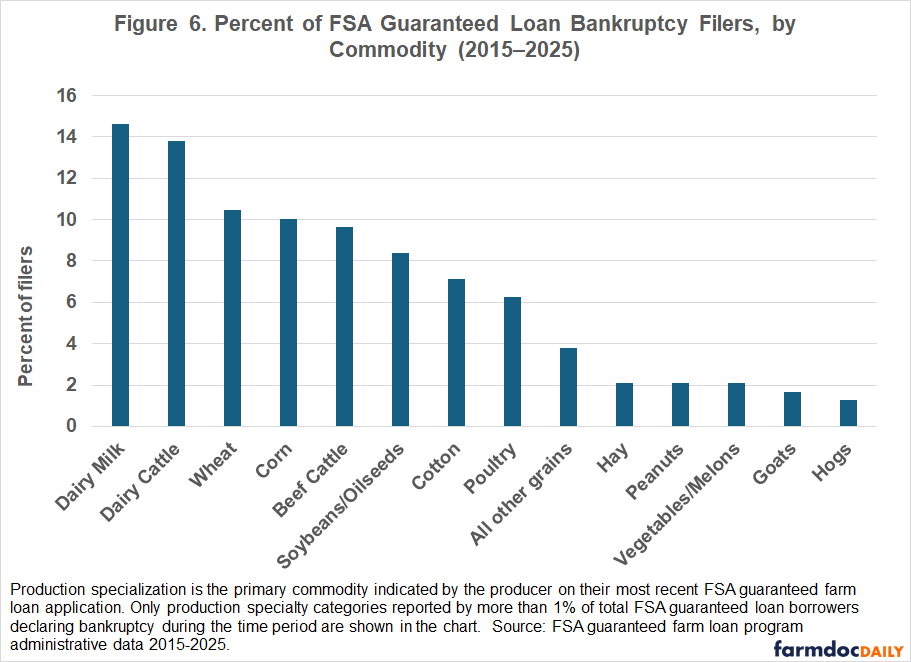
In terms of commodities, dairy operations are disproportionately represented by bankruptcy filers for both direct and guaranteed loans. For dairy, in particular, this is attributable to both a high concentration of these borrowers within the FSA loan programs as well as issues specific to the dairy industry. This includes generally high capital costs, thin margins, and price volatility within these sectors in recent years.
Bankruptcies in cotton are also most likely linked to repeated losses over the past few years. As of January 2026, states’ average cotton losses in 2025 were estimated at more than $300 per acre, following the losses received in 2024 and 2023 (Morgan, 2026). Additional analysis indicated that bankruptcies among FSA producers specializing in tobacco, cotton, peanut, hay, and rice production were likely to have received microloans or loans aimed at limited-resource borrowers, the latter indicating that the producers may have faced fewer economic resources to fall back upon in difficult times.
It is likely that the level of bankruptcy reported in the FSA data is due to past periods of lower cattle prices and high input prices resulting in low margins. Hence, these filings reflect the impact of financial stress felt in earlier years. The prevalence of cattle producers among FSA borrower bankruptcies reflects the nature of FSA direct-loan programs. FSA direct farm loans attract a significant share of cattle producers, many of these being small farming operations and/or operated by beginning or historically underserved borrowers. This group has been found to be more at risk of financial stress in times of falling farm incomes or overall farm economic stress (Key, 2019).
Borrower and Loan Specific Commonalities
To identify additional borrower and loan-specific commonalities and trends among filers by region, Principal Component Analysis and Clustering were used to sort borrowers into similar groups. These methods revealed certain key loan or borrower characteristics highly associated with bankruptcy filers in that region.
A high percentage of direct loan bankruptcy filers in Southern states were Native American producers, while a high percentage of filers in the Pacific and Delta regions were Hispanic, female, or African American producers. In the Southeast, there was a high percentage of Black or Asian guaranteed loan producers filing bankruptcy and a strong link to the type of lender. The Pacific region showed a strong association between guaranteed loan bankruptcy filings, longer loan length, and higher interest rates, while the Corn Belt also showed a strong correlation between guaranteed loan bankruptcy filing and loans with higher interest rates.
In the Appalachian, Northeast, Northern Plains, and Lake States regions, direct loan filers were likely to have received limited-resource loans, indicating their reliance on loan programs aimed at farmers with limited income or credit access, and to hold loans from both the direct and guaranteed programs simultaneously, indicating a graduation from direct to guaranteed loan programs at some point in the past. Finally, the Lake States, home to much of the country’s dairy production, showed a greater percentage of guaranteed loan filers with longer loan terms and/or having lines of credit.
Conclusion
The bankruptcy filings of FSA borrowers paint a picture of farm financial distress that is neither random nor evenly spread. Bankruptcies peaked and ebbed in relation to movements in farm income and government payments. Over the past decade, they have tended to cluster in specific states or regions, Wisconsin and Arkansas for example, and in specific sectors, particularly dairy, rice, cotton, and beef cattle. Bankruptcies are more likely to have a greater impact on specific types of borrowers, in particular beginning farmers and those qualifying for limited-resource programs or debt set-aside measures.
Realizing how these trends and patterns impact the likelihood of filing bankruptcy can be beneficial for program design. FSA programs with their extensive loan application process, local offices and lenders, annual borrower reviews, and established loan modification procedures make a significant step in the right direction. For at-risk borrowers, new measures could include additional borrower financial training, quarterly check-ins, periodically reviewing total farm and household debt levels and overall household financial health. More intensive monitoring for beginning farmers and limited resource borrowers may also be useful. Greater partnership with local resources such as extension services or farmer outreach programs to build business skills is another potential means to improve borrower outcomes.
Further Resources
Administrative Office of the U.S. Courts. (2026). Chapter 12 bankruptcy basics. https://www.uscourts.gov/court-programs/bankruptcy/bankruptcy-basics/chapter-12-bankruptcy-basics
American Farm Bureau Federation (AFBF), “Farm Bankruptcies Continued to Climb in 2025,” Market Intel, Feb. 2026, https://www.fb.org/market-intel/farm-bankruptcies-continued-to-climb-in-2025.
Key, Nigel. “Larger Farms and Younger Farmers Are More Vulnerable to Financial Stress” Amber Waves. Economic Research Service, October 22, 2019. https://www.ers.usda.gov/amber-waves/2019/october/larger-farms-and-younger-farmers-are-more-vulnerable-to-financial-stress
Morgan, Tyne. “At a Breaking Point, More Cotton Farmers Could Be Forced to Walk Away,” Agweb, Jan. 13, 2026. https://www.agweb.com/news/policy/ag-economy/hang-or-get-out-cotton-farmers-face-hardest-decision-their-lives
National Agricultural Law Center. (2026). An overview of Chapter 12 bankruptcy for family farmers and fishermen. University of Arkansas System Division of Agriculture. https://nationalaglawcenter.org
USDA Farm Service Agency. (2026). Guaranteed farm loans. https://www.fsa.usda.gov/resources/loans/guaranteed-farm-loans
Disclaimer: We request all readers, electronic media and others follow our citation guidelines when re-posting articles from farmdoc daily. Guidelines are available here. The farmdoc daily website falls under University of Illinois copyright and intellectual property rights. For a detailed statement, please see the University of Illinois Copyright Information and Policies here.