








2025 Illinois Farm Earnings Improve but Remain Below Recent Averages
Based on records from 1,927 certified usable farms enrolled in the Illinois Farm Business Farm Management Association (FBFM), average returns to farm operators’ labor and management increased in every region of Illinois in 2025 compared with 2024. However, returns remained below the five-year average. Although yields and costs were similar to the previous year, earnings improved because commodity prices exceeded beginning-of-year inventory values and farmers received Farmer Bridge Assistance payments. Higher livestock prices also increased returns for livestock farms.
Farm earnings were highest in northern, central, and western Illinois and lowest in eastern and southern Illinois.
Operators’ Labor and Management Earnings
The average return to an operators’ labor and management was negative $23,191 in 2025, an improvement from 2024 (Figure 1). This measure represents the farmer’s effective wage or salary after subtracting a fair return on the operators’ equity in machinery and land from net farm income. The 2025 return was $81,419 higher than the 2024 average of negative $104,610 but $139,505 below the five-year average. Across Illinois, operators’ labor and management income ranged from negative $210,024 in the southernmost part of the state to $26,901 in northeastern Illinois. The 2025 result was the third-lowest annual return of the past 10 years. During that period, labor and management income ranged from a low of negative $104,610 in 2024 to a high of $412,097 in 2022.
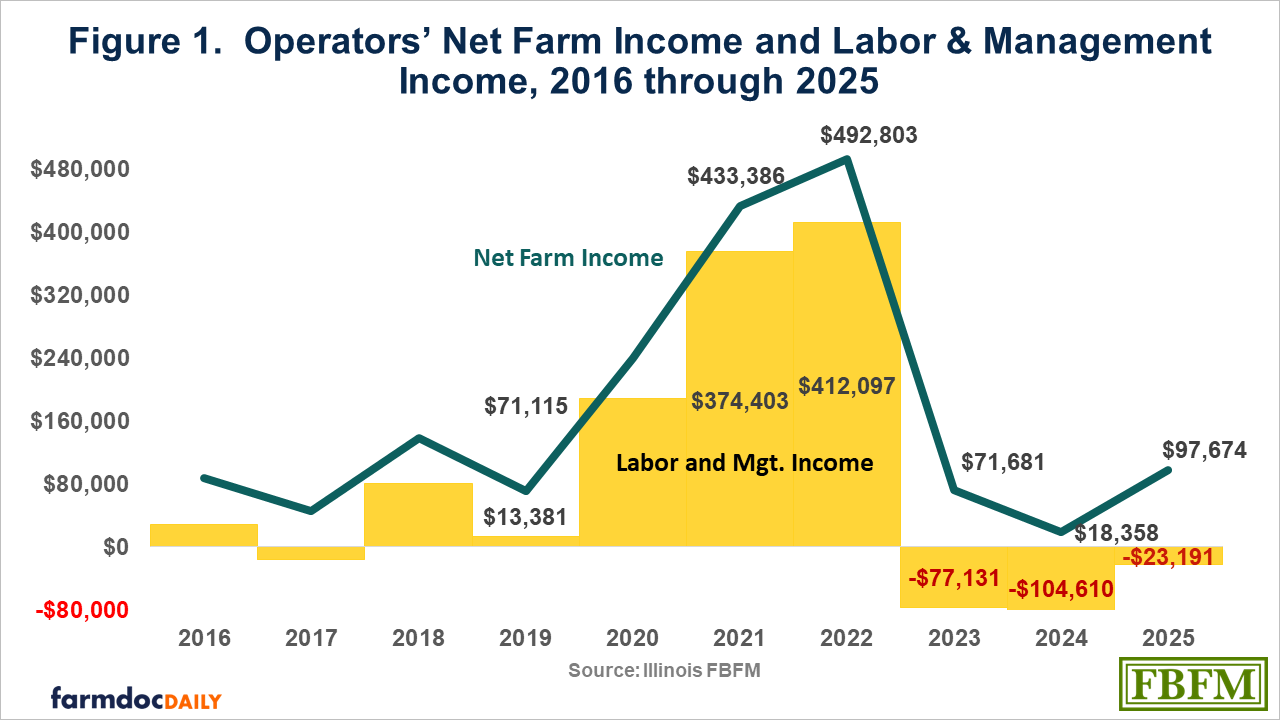
Although 2025 labor and management earnings remained low, farm earnings can be cyclical and can vary widely from year to year. Several factors that affect earnings—including weather, markets, and government policy—are outside farmer’s control, so a longer-term view is useful. Average labor and management earnings were $116,314 for 2021 through 2025 and $87,585 for 2016 through 2025. The 10-year average was $110,776 above the 2025 result. Excluding the two highest values in that 10-year period, which occurred in 2021 and 2022, reduces the average for the remaining eight years to $11,169. The 2025 earnings were considerably below both the five-year and 10-year averages.
Crop Yields and Prices
Corn yields in 2025 were 3 bushels per acre below the strong yields recorded in 2024, while soybean yields were unchanged. Across the 1,927 certified usable farms, corn averaged 231 bushels per acre and soybeans averaged 69 bushels per acre. Corn yields were highest in central Illinois, generally north of the I-74 corridor and along the I-39 corridor. Soybean yields also were generally highest in central Illinois. Average corn yields were the second-highest on record, while average soybean yields tied the record high. The year-end inventory price for the 2025 corn crop was $4.20 per bushel, 10 cents higher than a year earlier. Soybeans were inventoried at $10.20 per bushel, 60 cents above the December 31, 2023, value. The average prices received for 2024 corn and soybean crops sold in 2025 exceeded their respective inventory prices. Crop returns averaged $938 per acre, $65 more than in 2024. Even with that increase, average crop returns per acre were the second-lowest of the past five years and $356 below the 2022 high.
Earnings by Farm Type
Operators’ labor and management earnings were highest on dairy farms, followed by hog, beef, and grain farms. Average returns were $123,078 on dairy farms, $121,720 on hog farms, $38,018 on beef farms, and negative $25,273 on grain farms. Grain farms accounted for 92 percent of all farms, while hog farms accounted for 1 percent. Returns reported for livestock farms may also include returns from grain production.
The average farm size continues to fluctuate and was 1,322 tillable acres in 2025, 36 acres larger than the average five years earlier. Grain farms averaged 1,381 tillable acres, compared with 562 tillable acres for dairy farms.
Selected Costs Begin to Decrease
Per-acre fertilizer and pesticide costs decreased from 2024, while seed costs increased. However, total crop costs remained much higher than five years earlier. Across the 1,927 certified usable farms, crop costs averaged $335.71 per acre in 2025, compared with $335.48 in 2024. Fertilizer and pesticide costs each decreased 1 percent, while seed costs increased 3 percent. Compared with 2024, tillable acres planted to corn increased 1.7 percent and acres planted to soybeans decreased 1.6 percent. Compared with 2021, fertilizer costs increased 37 percent, pesticide costs increased 29 percent, and seed costs increased 18 percent. Fuel and oil costs averaged $25.91 per acre in 2025, compared with $27.34 in 2024 and $22.87 in 2021. Fertilizer and fuel costs are expected to increase in 2026 and 2027.
Spending on machinery and equipment decreased from the previous year. Capital expenditures fell 22 percent from 2024 to 2025, averaging $178,639 per farm, or $135 per tillable acre. Machinery purchases averaged $172 per tillable acre in 2024 and $243 per tillable acre in 2023.
Costs to Grow Corn and Soybeans
Total economic costs per acre to produce corn and soybeans decreased from 2024 in all areas of Illinois. Lower non-land interest and land costs were the main reasons for the decline. The cost per bushel of corn decreased in every area except southern Illinois because costs were lower and yields were generally similar to 2024; southern Illinois had lower yields. The cost per bushel of soybeans also decreased in every area except southern Illinois. On these farms, total economic costs averaged $1,187 per acre for corn and $878 per acre for soybeans.
Among a sample of Illinois grain farms, total economic costs averaged $5.16 per bushel for corn at an average yield of 230 bushels per acre and $12.54 per bushel for soybeans at an average yield of 70 bushels per acre. In 2024, the corresponding costs were $5.20 for corn and $12.90 for soybeans. Despite similar yields and lower costs in 2025, the corn cost was the third-highest per-bushel production cost since 2012. The 2025 soybean cost was 23 cents above the five-year average and $1.33 above the 10-year average, making it the fourth-highest per-bushel cost on record for soybeans. Because yields and costs have varied considerably in recent years, these results are best evaluated over more than one year. From 2016 through 2025, average production costs were $4.64 per bushel for corn and $11.21 per bushel for soybeans.
Livestock Returns
Returns above feed costs were higher than in 2024 for every livestock enterprise and exceeded the five-year average. Feed costs in 2025 were similar to 2024 levels for all livestock enterprises except beef cow herds, which had higher costs. Much higher pork prices were the main factor behind stronger hog returns. Farrow-to-finish hog producers were estimated to earn about $8 per hundredweight above the breakeven level needed to cover total economic costs in 2025. Dairy returns above feed costs were $4,041 per cow in 2025, compared with $3,423 in 2024. Milk prices were 1 percent lower and feed costs were 7 percent lower than a year earlier; however, most of the increase in dairy returns came from beef production. Feeder cattle returns were higher than in 2024 and reached their highest level in five years because producers received higher prices for market cattle. Prices paid for replacement cattle in 2025 were 29 percent higher than a year earlier. Prices received for market cattle were about $167 per hundredweight lower than prices paid for replacement cattle but 13 percent higher than the market price received in 2024. Returns above feed costs for beef cow enterprises increased by $656 per cow because of high market prices in 2025, producing the highest beef cow returns of the past five years.
Good Records a Key
The data used in this study come from the Illinois Farm Business Farm Management Association (FBFM). Without Illinois FBFM, information of this breadth and accuracy would not be available for educational purposes. FBFM is a not-for-profit organization serving more than 5,000 farmers through 80 professional field staff and is available to all Illinois farm operators. FBFM field staff provide on-farm counsel, recordkeeping assistance, farm financial management, business entity planning, and income tax management. For more information, contact the FBFM office in the University of Illinois Department of Agricultural and Consumer Economics at 217-333-8346 or visit www.fbfm.org.
Disclaimer: We request all readers, electronic media and others follow our citation guidelines when re-posting articles from farmdoc daily. Guidelines are available here. The farmdoc daily website falls under University of Illinois copyright and intellectual property rights. For a detailed statement, please see the University of Illinois Copyright Information and Policies here.