


Increasing Crop Insurance Coverage Levels: An Assessment
Introduction
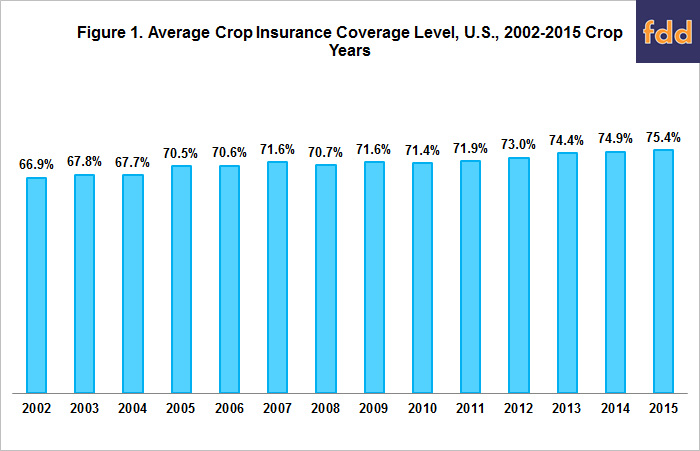
Average crop insurance coverage level has increased from 67% in 2002 to 75% in 2015 (see Figure 1). This period follows enactment of the Agricultural Risk Protection Act of 2000, the last stand-alone federal crop insurance act. The increase spans years before and during the crop boom, which is usually dated as starting with the 2007 crop. A common observation is that revenue variability increased during the crop boom. This observation is examined, as is the potential role net crop insurance payments to farms by insurance coverage level may play in increasing coverage levels.
Revenue Variability
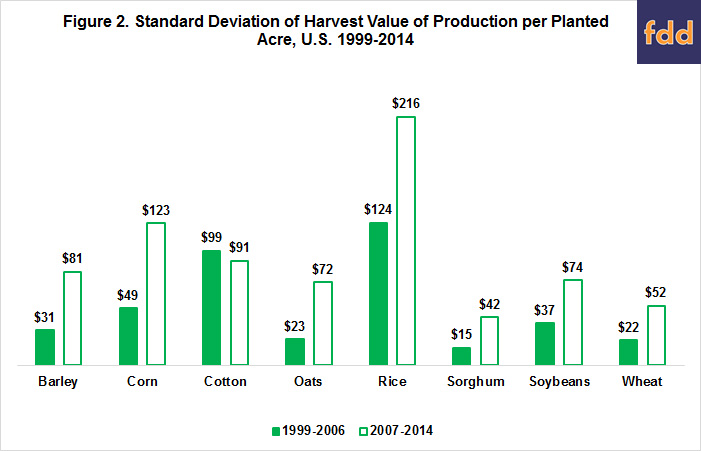
Cost of production data compiled by the U.S. Department of Agriculture (USDA), Economic Research Service reports a value of production per acre planted to a crop as of harvest. The value is market revenue. It does not include government payments, either from crop programs or insurance. Variation is calculated for 1999-2006 and 2007-2014. These identical-length periods are before and after the start of the crop boom in 2007. Two measures of revenue variability are calculated for each period: (1) standard deviation of a crop’s harvest time value of production per planted acre and (2) ratio of this standard deviation to the average harvest time value of production per planted acre. Both standard deviation and its ratio, known as a coefficient of variation, are commonly used measures of risk. Standard deviation of the value of production at harvest more than doubled after 2007 for all crops except rice and cotton (see Figure 2). Cotton is the only crop with a lower standard deviation after 2007. In contrast, no consistent pattern exists for the coefficient of variation. It increased for 4 crops, decreased for 3 crops, and is the same for wheat (see Figure 3). The average coefficient of variation across the crops is -0.8% smaller during 2007-2014 than 1999-2006. In summary, two commonly-used measures of variability generate different conclusions on whether crop revenue risk increased during the crop boom (see data note 1).

Net Insurance Payment per Insured Acre
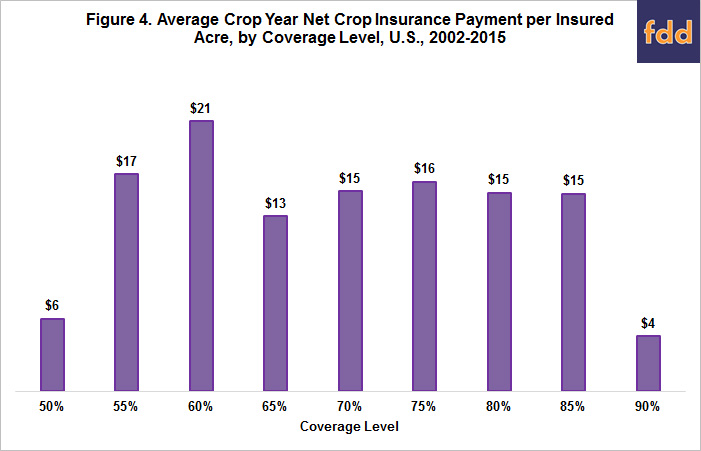
The net payment from crop insurance to farms is the difference between payments received from crop insurance and the insurance premiums farms paid. Farms do not pay the full premium as the federal government subsidizes them. Given these subsidies, it is not surprising that, since 2002, net insurance payment per insured acre for the U.S. are positive at all coverage levels (see Figure 4 and data note 2). What may be surprising is that net farm insurance payment per insured acre vary relatively little across coverage levels except for the 50% and 90% levels (see data notes 3 and 4). The combination of a relatively constant net insurance payment per acre across coverage levels up to 85% and the greater protection offered by higher coverage levels creates an incentive to buy higher coverage levels. This incentive is consistent with increasing coverage levels over time. It is important to underscore that this observation does not necessarily hold for an individual farm. It could pay more in premiums than it receives in payments. The observation is for farms as a group. Nevertheless, an observation for farms as a group has meaning to individual farms since crop insurance involves protection against events that approximate random events in a given crop year, such as weather related declines in yield.
Summary Observations
- U.S. farms as a group have been steadily increasing crop insurance coverage levels since 2000.
- Whether revenue variability has increased during the crop boom period depends on the measure used. It has increased if measured in dollars per acre at harvest, but has not changed if measured as a percent ratio of this standard deviation to the average revenue at harvest. Thus, revenue risk has increased if a farm views risk in terms of dollar per acre but not if risk is viewed in terms of percent variation. However, even if percent variation is used, a farm may still increase insurance coverage level since the dollar value of losses is greater for a given percent change. This consideration is especially important if the farm confronts a tight budget constraint.
- The higher dollar value measure of risk during the crop boom could explain at least in part the increase in coverage levels since 2007. Another factor could be the 2008 farm bill. It substantially increased premium subsidies for enterprise insurance, which has subsequently grown in popularity. While not diminishing the importance of these potential explanations, it is also important to note that insurance coverage levels were trending upward before the crop boom.
- Since 2002, net insurance payments to farms on a per acre basis are positive, as expected given premium subsidies. Moreover, on average, these per acre payments have not varied much between the 55% and 85% coverage levels. This consistency creates an incentive to elect higher coverage levels. Buying higher coverage increases the level of risk protection without leading to a decrease in net insurance payments per insured acre. This observation applies both before and during the farm boom.
- The preceding point implies that, unless the pattern of net insurance payments per acre across coverage level changes, farms are likely to continue to increase insurance coverage as a group.
References
U.S. Department of Agriculture, Risk Management Agency. April 2016. Summary of Business. http://www.rma.usda.gov/.
U.S. Department of Agriculture, Economic Research Service. April 2016. Commodity Cost and Return. (http://www.ers.usda.gov/data-products/commodity-costs-and-returns.aspx).
Data Notes
- The same conclusion is reached if all available cost of production data back to 1975 are used to calculate the pre-2007 standard deviation and coefficient of variation.
- Source of this data is the USDA, Risk Management Agency Summary of Business website.
- The 90% coverage level is available only with county, not individual farm insurance.
- The pattern of net insurance payments to farms by coverage level is similar if the analysis is limited to 2009-2015, or the period following the 2008 farm bill. It substantially raised the premium subsidy for enterprise insurance, which has subsequently increased in popularity.
Disclaimer: We request all readers, electronic media and others follow our citation guidelines when re-posting articles from farmdoc daily. Guidelines are available here. The farmdoc daily website falls under University of Illinois copyright and intellectual property rights. For a detailed statement, please see the University of Illinois Copyright Information and Policies here.