Debt, Repayment Margins and Farm Income
Earlier articles by Schnitkey and Zwilling (farmdoc daily, March 18, 2016; October 6, 2015; June 17, 2016) reviewed farm business liquidity in terms of the current ratio and working capital. This article reviews three measures of debt and repayment ability for a group of grain farms from 2003 to 2015 in light of lesser amounts of liquidity. This dataset of grain farms is divided into five groups by percentage of cash rented acres. Those groups are: 1) Under 25% Cash Rented Acres, 2) 25%-50% Cash Rented Acres, 3) 50%-75% Cash Rented Acres, 4) 75%-100% Cash Rented Acres and 5) 100% Cash Rented Acres. Data presented as repayment margins in this article refer to the median.
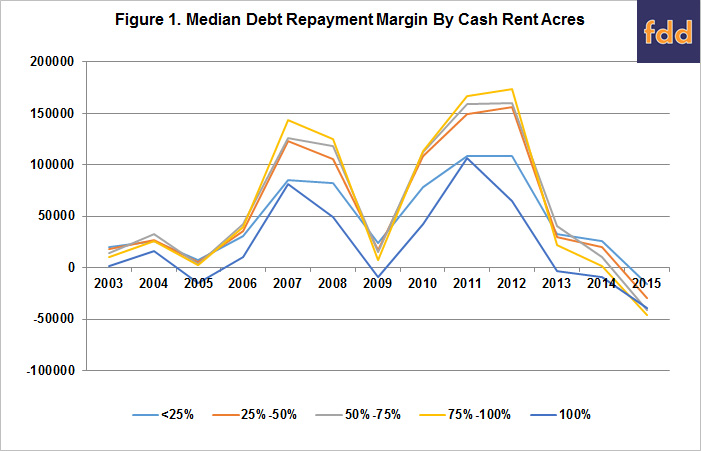
Capital Replacement and Term Debt Repayment Margin is calculated by adding farm operating income, net non-farm income and depreciation and then deducting any income and self-employment tax, family living expense and principal payment on the current portion of term debt. The measure permits an evaluation of the ability of the farm operator to generate funds necessary to repay debts with maturity dates longer than one year and to replace assets. It also presents a measure of the ability to acquire capital assets or service additional debt. This measure assumes that credit obtained for current year operating expenses are repaid in one year as a result of the normal conversion of farm production to cash. Higher margins are preferable to lower margins as they show a greater repayment ability.
Figure 1 shows the median Capital Replacement and Term Debt Repayment Margin. As a dollar value it is difficult to compare this measure from farm to farm, but trends over time are certainly identifiable. This data seems to suggest that lesser amounts of repayment margin are associated with farms that have 100% cash rented acres. In years where incomes are higher (2007 to 2012), the differences in Capital Replacement and Term Debt Repayment Margin become more apparent.

Figure 2 shows the same median Capital Replacement and Term Debt Repayment Margin but on a ‘Per Acre’ basis. In this case, this is per tillable operator acre. For the time period, there was only a single year (2007) where the Under 25% Cash Rented Acre group did not show the highest median repayment margin per acre. There were only three years where the 100% Cash Rented Acre group did now show the lowest repayment margin. The variances in this measure become more apparent in the years where farm incomes are greater (2007 to 2012). If you consider the 2003 to 2006 period where this repayment margin varies little for the five groups, it appears that the 2013 to 2015 period is much the same.

Figure 3 considers a different measure of repayment ability. Debt to Farm Operating Income is calculated by dividing average farm liabilities by the farm operating income. This provides a measure of the ability of the borrower to cover all debt relative to farm earnings. It does not take into consideration family living expenses or off-farm income as farm operating income is the divisor. To put this measure in perspective, consider this measure the number of years at the current farm income level needed to retire all debt. That thought can be difficult to understand as most farm operations are regularly retiring debt originated in prior years while adding new debt to replace machinery and buildings or acquire new assets that will boost the productivity of the farm.

In the 2003 to 2006 period, this measure was higher in general than later years. This could have been because of higher debt levels but was likely due to lesser amounts of farm operating income in those years. The lower levels of farm income in 2009 are shown in the slight bump up on the graph. The same holds true for the recent few years where the graph shows higher levels of Debt to Farm Income. The three groups higher cash rented acre groups show a negative farm operating income in 2015 making this measure very difficult to interpret. When farm operating income is negative is difficult to imagine how debt can be reduced.
Summary
Previous articles have reviewed liquidity measures in light of lower farm incomes, this article ties those challenges of lower liquidity to a lesser repayment capacity.
The authors would like to acknowledge that data used in this study comes from the local Farm Business Farm Management (FBFM) Associations across the State of Illinois. Without their cooperation, information as comprehensive and accurate as this would not be available for educational purposes. FBFM, which consists of 5,700 plus farmers and 60 professional field staff, is a not-for-profit organization available to all farm operators in Illinois. FBFM staff provide counsel along with recordkeeping, farm financial management, business entity planning and income tax management. For more information, please contact the State FBFM Office located at the University of Illinois Department of Agricultural and Consumer Economics at 217.333.5511 or visit the FBFM website at www.fbfm.org
References
Krapf, B., D. Raab, and B. Zwilling. "How Does the Percentage of Cash Rented Acres Affect Liquidity?" farmdoc daily (6):115, Department of Agricultural and Consumer Economics, University of Illinois at Urbana-Champaign, June 17, 2016.
Schnitkey, G. "Significant Reductions in Working Capital Likely in 2015 on Grain Farms." farmdoc daily (5):184, Department of Agricultural and Consumer Economics, University of Illinois at Urbana-Champaign, October 6, 2015.
Zwilling, B., B. Krapf, and D. Raab. "Working Capital and the Age of the Farm Operator." farmdoc daily (6):54, Department of Agricultural and Consumer Economics, University of Illinois at Urbana-Champaign, March 18, 2016.
Disclaimer: We request all readers, electronic media and others follow our citation guidelines when re-posting articles from farmdoc daily. Guidelines are available here. The farmdoc daily website falls under University of Illinois copyright and intellectual property rights. For a detailed statement, please see the University of Illinois Copyright Information and Policies here.


