


Reviewing the June 2017 CBO Baseline
On June 29, 2017, the Congressional Budget Office (CBO) released its updated estimates for the mandatory programs in the Agricultural Act of 2014, known as the baseline (see, USDA Mandatory Farm Programs and Supplemental Nutrition Assistance Baseline). It is standard practice by CBO to update its January estimates, which were discussed previously (see, farmdoc daily, March 2, 2017). This article reviews some of the key issues from the latest CBO Baseline.
The 2014 Farm Bill is Spending Far Less than Originally Expected
As Congress finished the Agricultural Act of 2014, CBO provided an estimate of the expected outlays from mandatory programs for the 2014 to 2023 fiscal years under the final bill and as compared to the May 2013 baseline (see, CBO Estimate January 28, 2014). At the time of its passage, CBO estimated that the 2014 bill would reduce outlays by $16.6 billion over the ten year window. According to CBO’s recent projections, as well as data from USDA on SNAP spending, the mandatory programs in the 2014 Farm Bill are costing substantially less than CBO had originally forecast. Figure 1 compares actual outlays to the forecasted spending for the 2014 to 2023 fiscal years based on the difference between the June 2017 Baseline and the January 2014 estimate.

Notably, the crop insurance program is expected to spend almost $21 billion less than CBO’s expectations when the farm bill was passed. This is largely due to the decreased price levels for the major insured crops, which reduces premium cost to the farmer and the amount of the premium covered by USDA. The reduced spending is not due to any changes to crop insurance enacted by Congress since the 2014 Farm Bill became law. SNAP is also expected to spend $41.5 billion less because of expectations that fewer people are participating in the program due to the improving economy and reduced unemployment, thereby reducing outlays. Conservation outlays are lower than the 2014 CBO score by about $4.5 billion (2014 to 2023), with reductions in multiple programs but no explanation by CBO. By comparison, PLC is expected to spend $11.5 billion more and ARC-CO is expected to spend $6.5 billion more during the 2014 to 2023 window. This is also due to the expectation that recent lower prices will be the norm going forward.
Perspectives on the Possible Baseline for the 2018 Farm Bill Debate
The Agricultural Act of 2014 is scheduled to expire in 2018. If Congress completes reauthorization next year, it is likely that the March 2018 CBO Baseline will be the estimates that provide the funding available for that effort. The June 2017 Baseline estimates provide perspective on the likely baseline for the next farm bill debate.
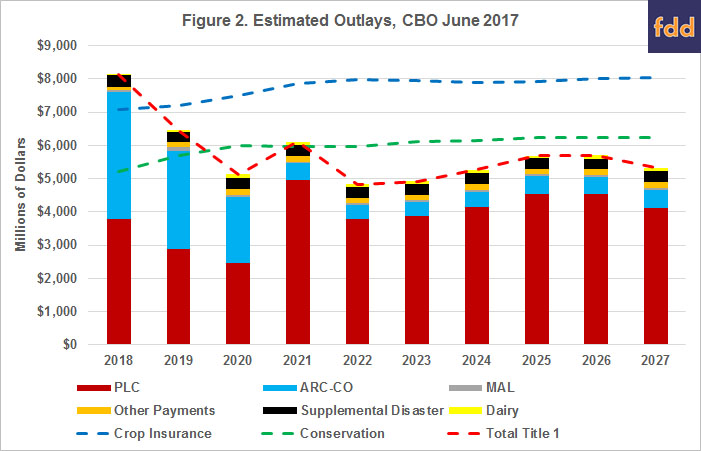
Figure 2 illustrates the 10-year budget window (2018 to 2027) from the June 2017 CBO estimates. The dashed lines represent the baselines for crop insurance, conservation and all Title I commodity programs; Title I programs broken down in the stacked bars. CBO continues to expect that crop insurance and conservation spending will outpace spending on Title I programs. ARC-CO and PLC are expected to continue to comprise the bulk of Title I spending, with very little spending by the Marketing Assistance Loans (MAL) program and dairy. Similar to previous estimates by CBO, PLC overtakes ARC-CO in the baseline after 2020. This is largely driven by CBO’s expectation that farmers will change their 2014 Farm Bill election, switching base acres to PLC and out of ARC-CO when they have the chance after 2018. Specifically, CBO expects that corn base enrolled in ARC-CO drops from 93% to 17.6% and that wheat base will move to 82% in PLC compared with 42.5% currently. Additionally, CBO expects soybean base acres to drop from 96.6% in ARC-CO to nearly 51% in PLC.
The Baseline within the CBO Baseline: Commodity-by-Commodity Outlays
CBO also provides significant information for each of the programs and covered commodities, which further explains the baseline outlay estimates. As discussed above, this includes expectations for how many base acres are enrolled in ARC-CO or PLC, as well as price and yield forecasts and expectations for supply, use and ending stocks. By delineating projections for each Title I covered commodity, CBO provides individual commodity baselines within the overall baseline. This information can be useful in comparing how the programs are working for each of the covered commodities and is an indicator of the politics of farm program debates. For example, Figure 3 illustrates CBO’s estimated total outlays for each of the major commodities covered by Title I programs (ARC, PLC and MAL). It also includes the STAX program for upland cotton and some of the other outlays for cotton such as the $300 million in ginning cost share provided by USDA in 2016 and the more than $40 million provided each year in economic assistance to cotton mills.
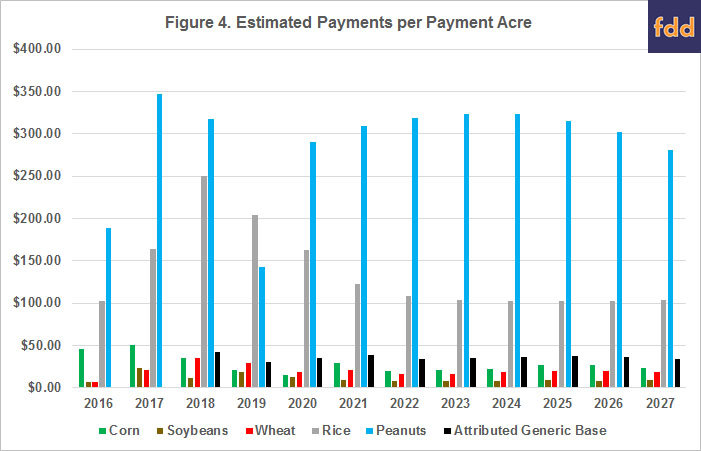
Figure 3 provides one perspective on spending per commodity. Importantly, corn, soybeans and wheat have far more base acres in the programs than rice or peanuts. Another perspective is to calculate an average payment per program acre by dividing total ARC-CO or PLC payments to the commodity by the commodity’s total payment acres (i.e., 85% of the base acres). This perspective is provided in Figure 4. To complete the comparison for Title I crop programs, Figure 4 also includes CBO’s estimates of payments on attributed generic base, calculated on 85% of the base acres attributed to covered commodities on generic base.

Figure 4 makes it clear that while the total baseline for rice and peanuts is smaller, the expected payments per payment acre for those two crops are substantially higher than for corn, wheat or soybeans. CBO expects that on average, rice base will receive $135 per payment acre while peanuts will average $288 per payment acre. By comparison, corn and wheat average $28 and $20 per payment acre, respectively. This vast difference in payments is mostly determined by the reference price levels Congress fixed in statute as compared to CBO’s forecast for the marketing year average prices (MYA). Figure 5 provides one measure of the relationship between reference prices and MYA prices for each of the major commodities. To trigger payments, the reference price would have to be more than 100% of the MYA price, indicating that MYA prices are below the reference price. For example, CBO forecasts the 2017 wheat MYA at $4.25 per bushel on a reference price of $5.50 per bushel; the wheat reference price would be 129% of the MYA and would be expected to trigger a PLC payment on wheat base acres enrolled in the program.
Combined, Figures 4 and 5 also provide a measure of equity amongst the major commodities that receive Title I payments. Peanuts clearly have received the highest reference price amongst these commodities. Because of the way in which the CBO Baseline works, Congress can typically provide small base-acreage crops like peanuts and rice with disproportionately high reference prices. The smaller base acres do not produce large outlays in the baseline even if the programs provide large payments on those acres, as indicated by comparing Figures 3 and 4. Wheat and rice appear to be two different exceptions and are discussed further.

First, rice’s reference price appears low, especially in the out-years of the forecast (falling to low 90% range by 2021) but Figure 4 indicates continued high per-payment acre payments. This could be due to the fact that there are three different classes of rice covered by the program (long-grain, medium/short-grain which includes Temporate Japonica). Long-grain and medium grain receive the same $14.00 per cwt reference but are grown in different regions (long-grain predominately in the Southeast, medium grain in California) with different MYA prices; NASS data indicates long-grain rice’s MYA averaged 73% of medium/short grain rice from 2009 to 2015 (see, USDA-NASS and USDA-ERS Rice Yearbook). This would result in larger payments to rice base in the Southeast that skews the per-payment acre estimates in Figure 4. CBO, however, does not distinguish among the classes of rice in its baseline document.
Second, the wheat reference price is high relative to MYA prices, which drives outlay estimates for wheat in Figure 3. The relatively lower payment yield for wheat is largely responsible for holding down wheat’s average payment per payment acre. CBO’s average payment yield in the baseline is 38.2 bushels per acre, which is more than 10 bushels per acre lower than the average harvested yield. Recall that the PLC payment is determined by the difference between the reference price and the MYA, multiplied by the payment yield and paid on 85% of the base acres.
Concluding Thoughts
The CBO Baseline highlights some of the significant issues likely to be debated in the upcoming farm bill: outlays and equity of payments. The baseline creates a zero-sum effort under which any changes that increase spending have to be offset from spending in the baseline, thus adding cottonseed or expanding CRP will require reductions elsewhere. Figures 2 and 3 indicate where the offsets will likely have to be found. Finally, previous farm bills have involved debates about the equity of payments among program crops. As discussed, this is largely an issue with program design, such as the setting of reference prices. It is likely to be an issue once again in the upcoming farm bill debate as indicated by Figures 4 and 5.
References
Congressional Budget Office. "CBO's June 2017 Baseline for Farm Programs." Released June 29, 2017, accessed July 14, 2017. https://www.cbo.gov/sites/default/files/recurringdata/51317-2017-06-usda.pdf
Congressional Budget Office. "Supplemental Nutrition Assistance Program - CBO's June 2017 Baseline." Released June 30, 2017, accessed July 14, 2017. https://www.cbo.gov/sites/default/files/recurringdata/51312-2017-06-snap_1.pdf
Congressional Budget Office. "CBO's June 2017 Baseline for Farm Programs." Released June 29, 2017, accessed July 14, 2017. https://www.cbo.gov/sites/default/files/recurringdata/51317-2017-06-usda.pdf
Coppess, J., C. Zulauf, N. Paulson, and G. Schnitkey. "Reviewing CBO Baseline for Farm Bill Program Spending." farmdoc daily (7):39, Department of Agricultural and Consumer Economics, University of Illinois at Urbana-Champaign, March 2, 2017.
Disclaimer: We request all readers, electronic media and others follow our citation guidelines when re-posting articles from farmdoc daily. Guidelines are available here. The farmdoc daily website falls under University of Illinois copyright and intellectual property rights. For a detailed statement, please see the University of Illinois Copyright Information and Policies here.