


Planting Delays and Switching to Soybeans: A New FAST Spreadsheet
Recent wet weather again raises concerns about planting delays, potentially leading to questions on whether to plant corn or soybeans on farmland that was scheduled to be planted to corn. We have developed a FAST spreadsheet named the Planting Decision Model that calculates corn and soybean returns by date of planting. Using current commodity prices and costs, switching to more soybeans seems several weeks away. For northern and central Illinois, corn is projected to be more profitable than soybeans throughout May. In southern Illinois, corn is projected to be more profitable than soybeans through the last part of May. Commodity prices play a key role in return differentials. Current commodity prices favor corn compared to what one would expect with more typical prices.
Returns Estimated by Planting Date
The Planting Decision Model is part of our FAST series and runs on Microsoft Excel. The spreadsheet can be downloaded from the FAST section of farmdoc. The direct link to the Planting Decision Model is here.
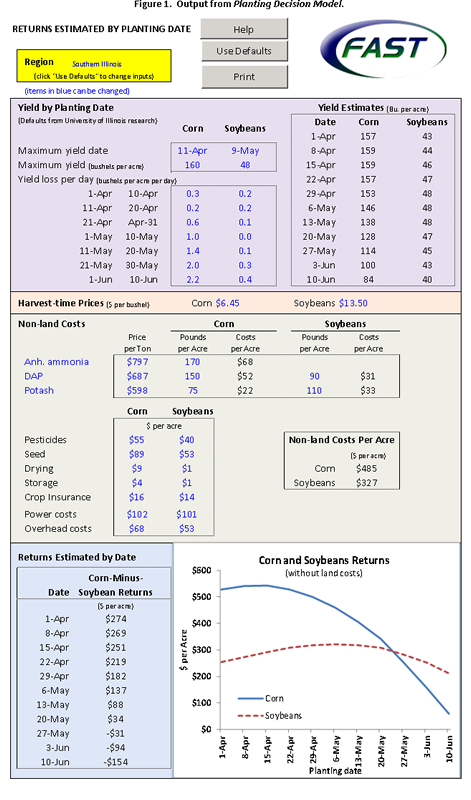
The Planting Decision Model includes a sheet that estimates corn and soybean yields by planting date. Figure 1 shows an example of the screen using defaults for southern Illinois. This model includes defaults for four regions: 1) northern Illinois, 2) central Illinois with high-productivity farmland, 3) central Illinois with low-productivity farmland, and 4) southern Illinois. Key factors impacting returns estimates are yield by planting date, harvest-time prices, and non-land costs.
Yield by planting date: Yields for differing planting dates are taken from research conducted by Emerson Nafziger and Vince Davis, as presented in The Bulletin, a publication of the Department of Crop Sciences, University of Illinois ( download “Corn Planting Date Revisited” released on April 10, 2009 here and “Should I Start Planting Soybeans in April released on April 23, 2010 here).
For each region, a yield estimate is given that has a maximum yield on a given date. Yield then declines from this maximum. For example, the maximum yield for corn in central Illinois is 198 bushels and occurs on April 20th. Yield then decline .1 bushel per acre per day from April 21st to April 31st, .4 bushels per day from May 1 to May 10, .6 bushels from May 11 to May 30, 1.0 bushel per day from May 21 to May30, and 1.2 bushels per day from June 1 to June 10. Other regions have different yield functions.
Obviously, these yield estimates should be taken as expectations, as actual yields will vary from those presented in the tool due to growing season conditions. Good growing conditions would result in higher yields, as occurred in many areas in 2008. Worse growing conditions could result in much lower yields.
Harvest-time commodity prices: Forward prices from elevators and other delivery points provide good estimates of prices at which grain can be sold at harvest. Defaults in the model are $6.45 per bushel for corn and $13.50 per bushel for soybeans, close to prices being offered in late April. Note that these prices are above the more “typical” longer-run expected price of $4.00 per bushel for corn and $10.00 per bushel for soybeans. Compared to $4 and $10, current prices lead to higher corn returns compared to soybean returns.
Non-land costs: The model includes defaults based on University of Illinois budgets. Current costs are high from a historical perspective, with the difference in corn and soybean costs approaching $200 per acre.
Based on the above inputs, corn-minus-soybean returns are estimated by planting date. In the example, shown in Figure 1, corn-minus-soybeans returns is estimated at $274 per acre, meaning that corn is projected to be $274 per acre more profitable than soybeans. Corn-minus-soybean returns decline and become negative on May 27th. Decreases in corn-minus-soybean returns through the planting season are typical, with overall levels varying by
region.
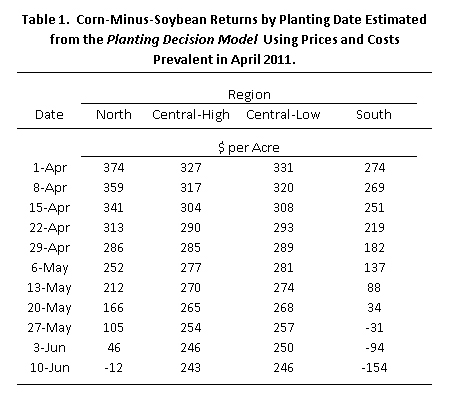
Returns Estimated by Region
Using defaults within the Planting Decision Model, corn-minus-soybean returns are estimated for northern Illinois, central Illinois with high-productivity farmland, central Illinois with low-productivity farmland, and southern Illinois (see Table 1). For northern Illinois, corn-minus-soybean returns remain positive until the second week of June. In Central Illinois, corn-minus-soybean returns are positive for all dates between April 1 and June 10. For southern Illinois, corn-minus-soybean returns turn negative in the third week of May.
Commodity Prices
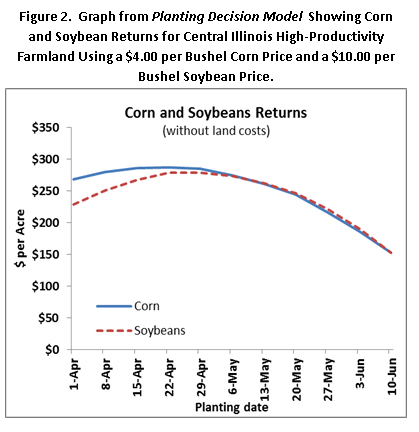
Commodity prices play a large role in determining corn-minus-soybean returns. The $6.45 price for corn and $13.50 price for soybeans favor corn production by a much larger margin than more typical prices are $4 per bushel for corn and $10 per bushel for soybeans. For central Illinois farmland of high productivity, a $4 corn and $10 soybean price causes corn-minus-soybean returns to turn negative in the second week of May and the difference in corn and soybean profitability would be much smaller, as illustrated in Figure 2 which shows a corn and soybean returns graph produced by the Planting Decision Model. Hence, changes in commodity prices will impact estimated returns by planting date.
Summary
The Returns Estimated by Planting Date sheet in the Planting Decision Model will be useful in evaluating whether to switch from corn to soybeans. In southern Illinois, soybeans begin to be projected more profitable than corn towards the end of May. Switching for northern and central Illinois likely occurs in June. Switching dates are sensitive to corn and soybean prices.
Disclaimer: We request all readers, electronic media and others follow our citation guidelines when re-posting articles from farmdoc daily. Guidelines are available here. The farmdoc daily website falls under University of Illinois copyright and intellectual property rights. For a detailed statement, please see the University of Illinois Copyright Information and Policies here.