


Illinois Agricultural Credit Conditions in the Second Quarter of 2025
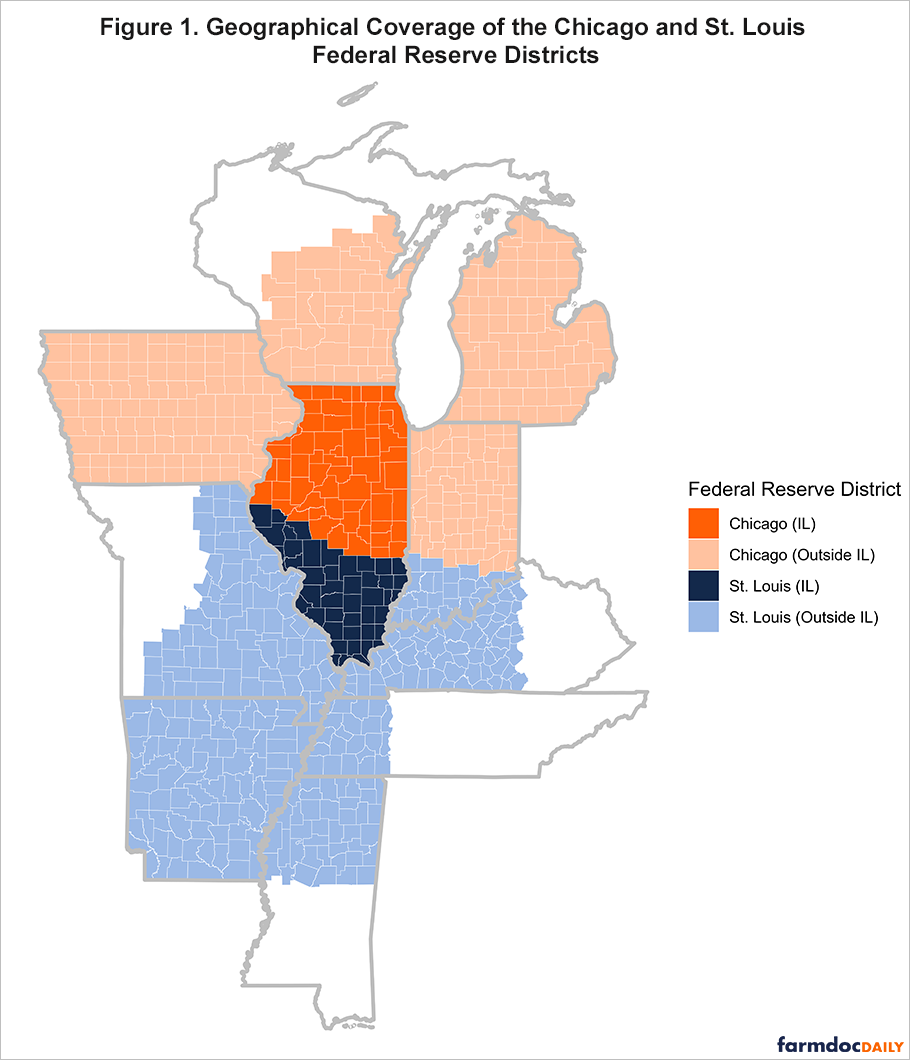
The Federal Reserve District Surveys of Agricultural Credit Conditions compile key statistics from quarterly surveys of commercial banks within each district. These surveys track agricultural credit trends using responses from banks chartered in each district’s geographic area. In today’s article, our analysis focuses on the two districts that cover Illinois: The Federal Reserve Bank of Chicago, which includes 58 counties, and The Federal Reserve Bank of St. Louis, which includes 44 counties (see Figure 1).
Demand for Loans Are Higher in the Chicago District
In the second quarter of 2025, year-over-year loan demand in the Chicago district exceeded that of the St. Louis district (Figure 2). Bankers participating in the Federal Reserve’s Agricultural Credit Conditions Survey assess current loan demand by comparing it to the same quarter a year earlier—indicating whether demand is higher, lower, or unchanged. Their responses are used to calculate a diffusion index: the percentage reporting “lower” demand is subtracted from the percentage reporting “higher,” then 100 is added. A value above 100 signals net growth in loan demand compared to a year earlier; a value below 100 signals net decline.
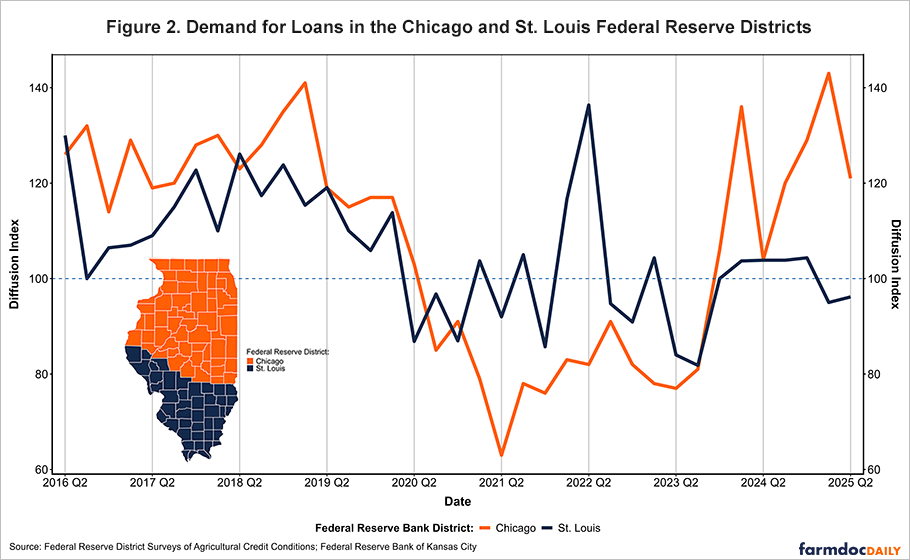
In 2024, loan demand in the St. Louis district held steady, with diffusion index values ranging between 103 and 104 throughout the year. The Chicago district, however, saw more volatility—falling from 136 in the first quarter to 104 in the second, before recovering to 129 by year-end.
According to data from the Illinois Farm Business Farm Management (FBFM) Association, median total liabilities for grain farms rose 7.73% in 2024, increasing to $717,708 from $666,237 in 2023. While median intermediate liabilities declined 6.69% (from $55,622 to $51,900), long-term liabilities climbed 10.46%, from $222,224 to $254,555.
So far in 2025, the survey indicates distinct differences in loan demand trends between districts. In the St. Louis district, demand remains below the neutral mark of 100, however it edged up slightly—from 95.00 in the first quarter to 96.16 in the second—but represents a decline compared to a year ago. Meanwhile, the Chicago district stayed above 100, but saw a notable drop over the past quarter, with demand falling from 143.00 to 121.00 over the same period.
Collateral Requirements Are Rising
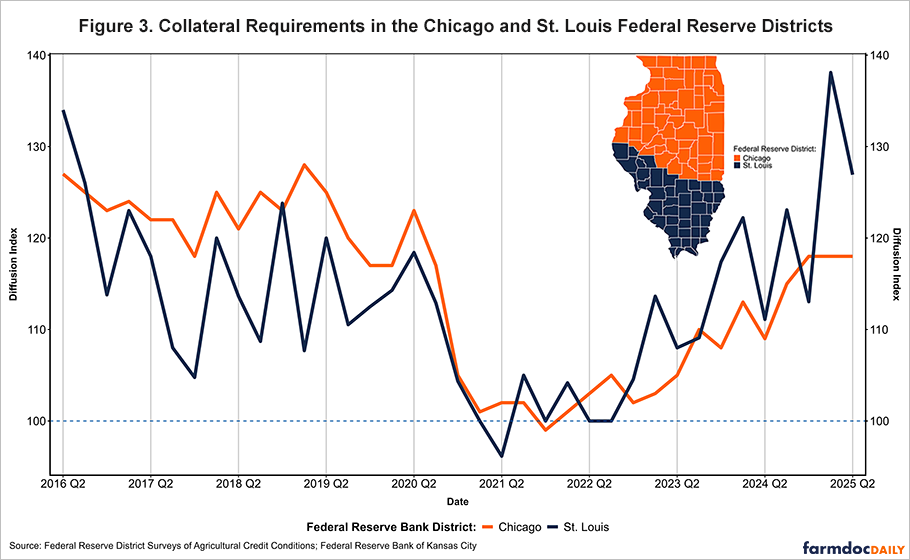
Collateral requirements have increased notably in both districts over the past two years, indicating tighter lending standards relative to prior years. Here, the diffusion index reflects lenders’ assessments of whether current collateral requirements are higher, lower, or the same compared to the same quarter a year earlier.
As shown in Figure 3, the Chicago district’s index rose from 109 in the second quarter of 2024 to 118 by the end of the year and has remained at that level through the first two quarters of 2025—suggesting that a growing share of lenders continue to report tighter collateral requirements year-over-year. The St. Louis district showed more pronounced swings: the index rose from 111.11 in Q2 2024 to 123.08 in Q3, dipped to 113.04 in Q4, then surged to 138.10 in Q1 of 2025—the highest value in the period—before easing slightly to 126.92 in Q2. Overall, both districts continue to report more restrictive collateral terms compared to a year earlier.
Loan Repayment Rates Are Lower than They Were a Year Ago
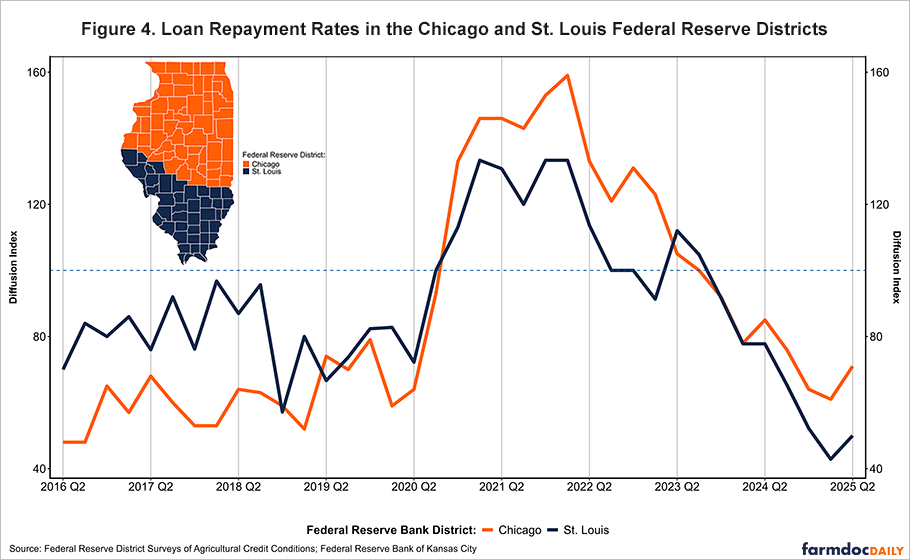
Loan repayment conditions have remained weak in both districts since early 2022, as shown in Figure 4. The index values have been below 100 throughout this period, indicating that more lenders continue to report lower repayment performance compared to a year earlier. By the end of 2024, the index had declined to 64.00 in the Chicago district and 52.17 in the St. Louis district—suggesting worsening repayment conditions. In the second quarter of 2025, both districts showed modest improvement: the index rose to 71.00 in Chicago and 50.00 in St. Louis. However, because both values remain well below 100, repayment performance is still declining on a year-over-year basis, though at a slower pace.
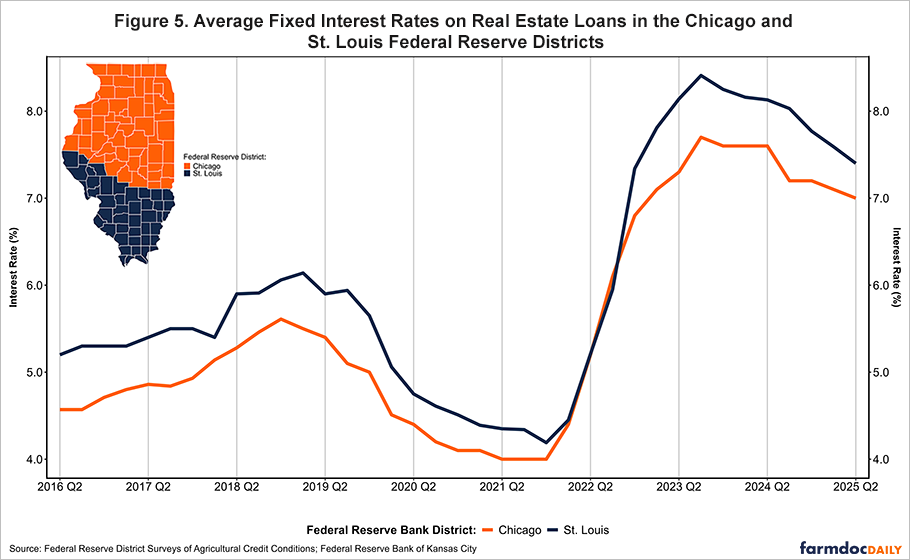
Fixed Interest Rates on Farmland Loans Have Declined
Average fixed interest rates on real estate loans have declined in both the Chicago and St. Louis districts since peaking in 2023, as shown in Figure 5. In the Chicago district, rates reached a high of 7.7% in the third quarter of 2023 and have gradually declined since, falling to 7.0% by the second quarter of 2025. A similar trend occurred in the St. Louis district, where rates peaked at 8.4% and fell to 7.4% over the same period. These declines, though modest, come after a sharp increase in borrowing costs that began in the spring of 2022 when the Federal Reserve started raising the federal funds rate to combat inflation. Despite the cuts in interest rates by the Fed, rates for farmland loans remain well above pre-2022 levels.
Conclusion
In summary, agricultural credit conditions in Illinois remain under strain, but there were some signs of improvement in the second quarter of 2025. Loan demand trends diverged between the state’s two Federal Reserve districts: the Chicago district continued to report net growth in demand compared to a year earlier, though at a slower pace, while the St. Louis district remained below the neutral level, indicating ongoing weakness. Rising collateral requirements in both districts suggest that lenders are maintaining tighter credit standards. Loan repayment indexes also improved modestly, pointing to a potential easing in financial stress, though repayment performance remains weaker than a year ago. Lastly, fixed interest rates on farmland loans have declined slightly from their 2023 peaks, but borrowing costs are still well above pre-2022 levels.
Acknowledgment
The author would like to acknowledge that data used in this study comes from the Illinois Farm Business Farm Management (FBFM) Association. Without Illinois FBFM, information as comprehensive and accurate as this would not be available for educational purposes. FBFM, which consists of 5,000+ farmers and 70 professional field staff, is a not-for-profit organization available to all farm operators in Illinois. FBFM field staff provide on-farm counsel along with recordkeeping, farm financial management, business entity planning and income tax management. For more information, please contact our office located on the campus of the University of Illinois in the Department of Agricultural and Consumer Economics at 217-333-8346 or visit the FBFM website at www.fbfm.org.
Disclaimer: We request all readers, electronic media and others follow our citation guidelines when re-posting articles from farmdoc daily. Guidelines are available here. The farmdoc daily website falls under University of Illinois copyright and intellectual property rights. For a detailed statement, please see the University of Illinois Copyright Information and Policies here.