


Off-Base, Part 3: Picking Winners & Losers with Policy
Old Man Winter, that popular personification of less-than popular weather, struck again this week and may have more in store (see, NPR, January 27, 2026; Ghaffar, January 27, 2026; Rucker and Rojas, January 26, 2026; Tuthill, December 17, 2014). Reading Robert Frost in the January cold (Frost, “An Old Man’s Winter Night”) is little comfort, however, when more troubling storms conjure a Shakespearian “winter of our discontent” (Shakespeare, “Richard III”; Erden et al., January 25, 2026; Inal, et al., January 9, 2026; Homans, January 25, 2026). On a far different level, discontent could also describe the issues with base acres explored in this and the previous articles in this series (farmdoc daily, January 15, 2026; January 22, 2026).
Background
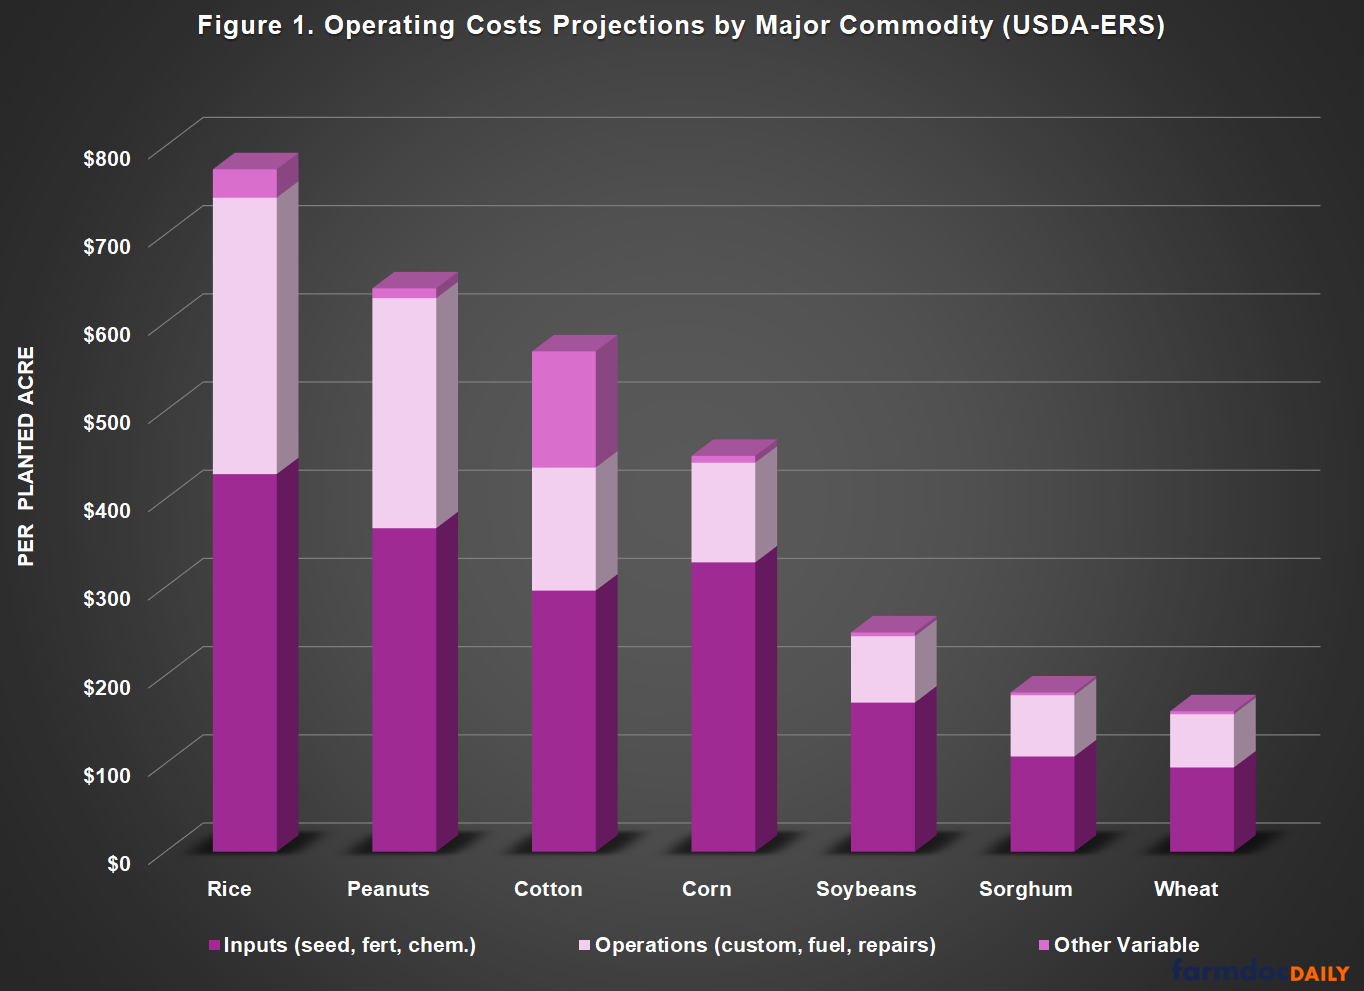
USDA’s Economic Research Service publishes forecasts for the costs of production of the major commodities (USDA-ERS, “Commodity Costs and Returns”). The costs are broken into two categories, operating cost and overhead (or allocated overhead). Operating costs include the input costs for the crop (seed, fertilizer and chemicals), operating expenses (fuel, custom operations and repair costs) and other variable expenses, including interest on operating capital. ERS notes that custom operations costs include technical services and commercial drying, while variable expenses include purchased irrigation water, cotton ginning, and baling straw. Figure 1 illustrates these cost forecasts for 2026 organized by input, operating, and other variable costs.
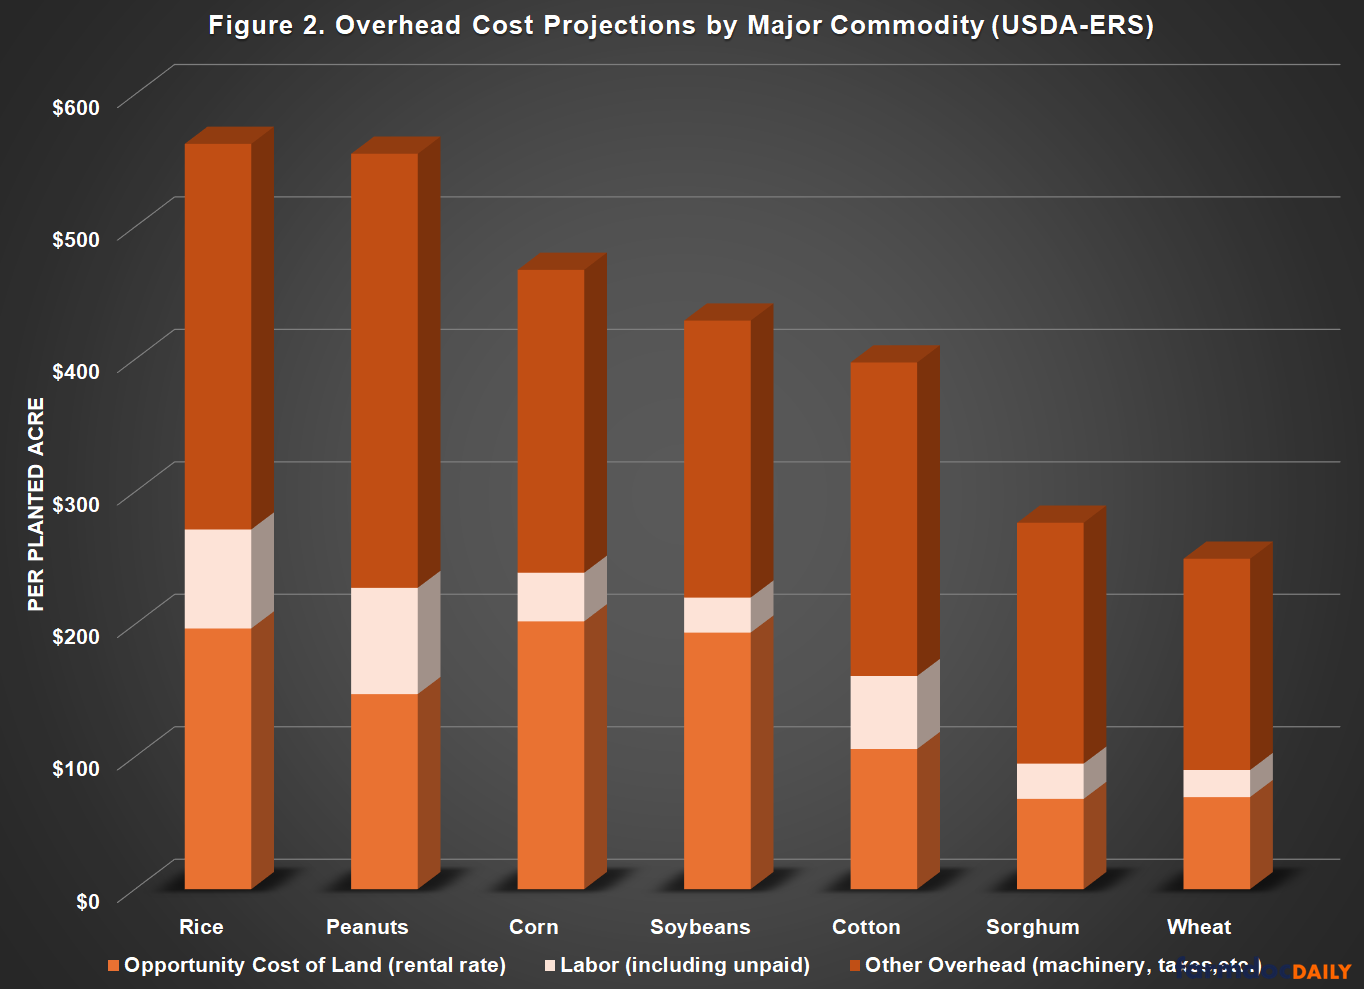
Overhead expenses include the same items for all crops. They are organized in Figure 2 beginning with the opportunity cost of land (or rental rate), labor (both hired labor and the opportunity cost of unpaid labor), and other overhead (capital recovery of machinery and equipment, taxes and insurance, and general farm overhead). Note that the highest opportunity cost of land forecast by ERS is for corn.
Discussion
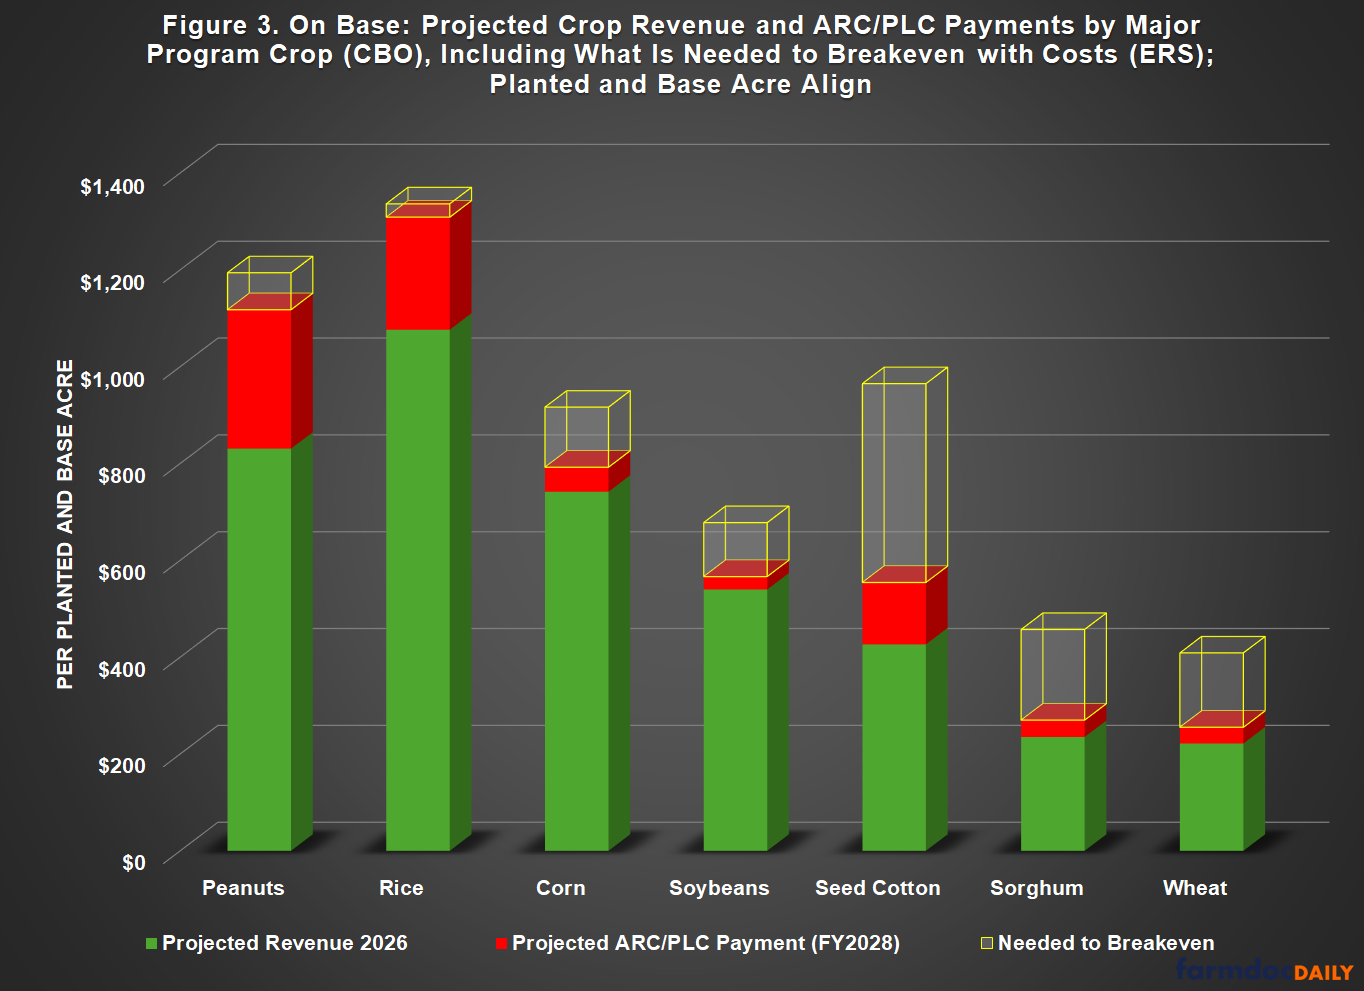
The Congressional Budget Office recently released its baseline projections for the USDA mandatory programs and they include projected prices and yields for the major program crops, as well as payment projections (CBO, February 2026; farmdoc daily, January 22, 2026). Figure 3 illustrates the on-base perspective, when the planted acre aligns with the base acre (e.g., corn planted on corn base). These amounts are from CBO projections for revenue (marketing year average prices and yield per planted acre) plus the projected ARC/PLC payments for the 2026 crop year, paid in fiscal year 2028. Finally, Figure 3 also includes the amount necessary to breakeven with total costs as forecast by ERS (difference between total costs and the income from revenue and payments). Based on these projections, all major program crops are expected to have higher costs than income (crop revenue and payments when planted and base align).
The questions explored in these articles, however, concern the off-base situations, which compares income from crop revenue and payments when a crop is planted to something other than its base acre. Figure 4 illustrates this for corn planted to base acres of the major program crops. With total costs of production for corn projected by ERS in the background, the income from projected corn revenue and ARC/PLC payments are in stacked columns. The figure also includes the amount necessary to breakeven with projected corn costs. Notably, corn planted to peanut base and rice base would be profitable under these projections, and it would be much closer if planted to seed cotton base than to corn or the other base acres.
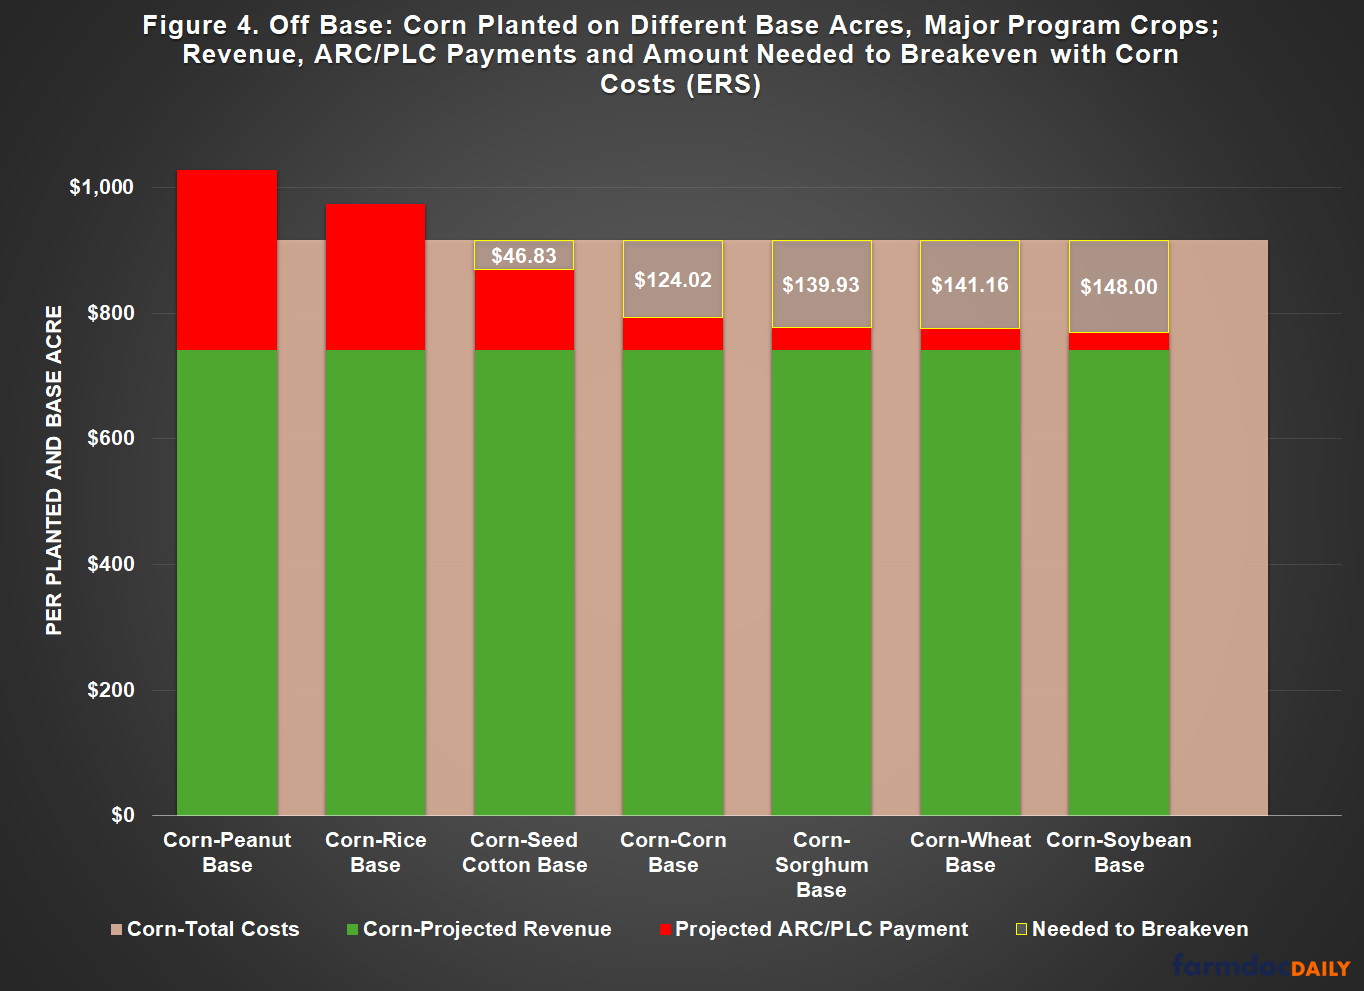
Under these projections, farmers planting corn on peanut and rice base would go from projected losses to profit solely due to the payments on those base acres. Note that the total costs for corn were used but the overhead costs highlight a challenge in this measure concerning the projections for opportunity cost of land (rent rate). It might be more accurate to calculate total costs for corn using the rental rate associated with the base acre. For example, if the opportunity cost of land for cotton is used in the overhead costs, planting corn to seed cotton base becomes profitable by nearly $50 per acre.
Figure 5 provides the same off-base perspective for soybeans planted to different base acres. With the total costs (operating and overhead) for soybeans in the background, the bars are the revenue for planted soybeans with the projected payments for the base acre of the other crops. The amount needed to breakeven with soybean costs are also included. Once again, soybeans planted on peanut and rice base become profitable because of the payments, and it is very close for soybeans planted to seed cotton base. In those cases, farmers planting soybeans get large enough payments that income exceeds costs.
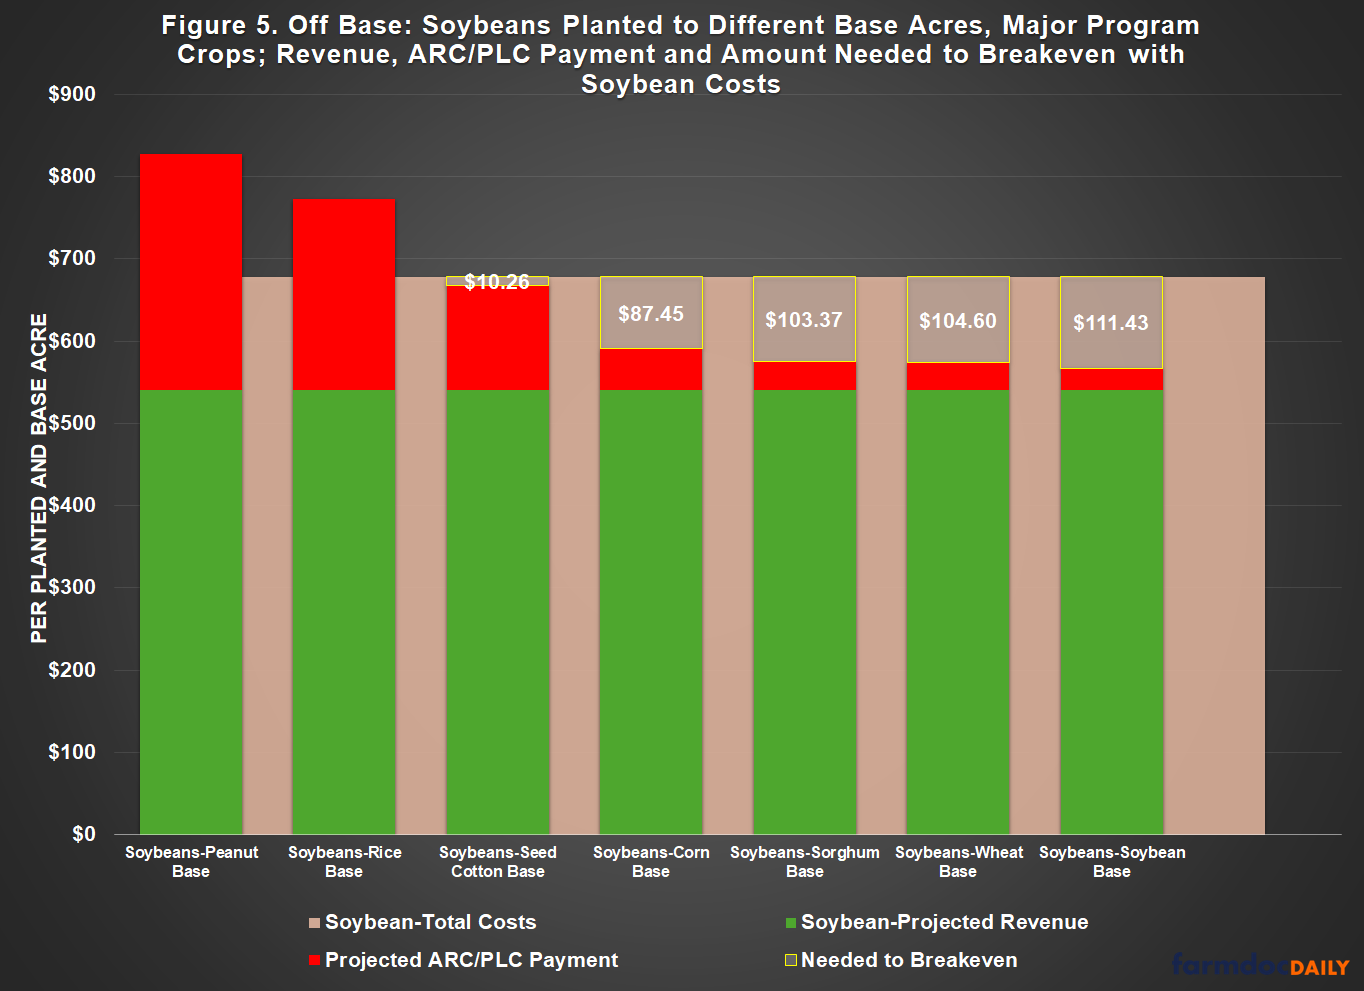
As with corn, the national average opportunity cost of land for soybeans is higher than for most of the other program crops. The comparison is more concerning if the opportunity cost of land (rental rate) associated with the base acre is used. In that case, only planting soybeans to corn base or on soybean base remains negative, below breakeven with soybean costs. But these remain national level estimates and projections. Understanding this issue would benefit greatly from localized data, analysis, and comparisons.
Concluding Thoughts
Policy should not pick winners and losers. That well-worn phrase in DC circles is proclaimed more often than followed; the most adamant advocates tend to be the least likely to live by it, or practice what they preach. There is proof of the problems the adage counsels against in the base acre design for farm policy. As explored in this article, the most recent projections for crop costs, revenues and payments highlight the potential that extraordinarily large payments on southern base acres of peanuts, rice, and seed cotton will make the difference between profit and loss for those farmers who can plant those base acres to corn and soybeans.
Frustrated farmers are right to ask how this happens and why. James Madison promised a competition among factional interests to deliver for the public good, but the deck was stacked in the system’s design in favor of the smallest of them; intended or not, the design effectively proved his points (see, Federalist No. 10; Federalist No. 51). Budget policy with its ten-year scoring barriers and special gimmicks like reconciliation have made it exponentially worse. Now, the smallest factions barely need to compete at it and the public’s interests are deemed unaffordable. Evidence can be found in policy designs like base acres and huge payments for crops not planted, but the details are all too complicated and obscure.
The routine is so familiar by now that it almost seems self-perpetuating. A recent story about the problems for rice in the Mississippi Delta serves as an example (Draper, January 25, 2026). When one realizes that fewer than 5% of the acres in the county are planted to rice—which has 16% of the county’s base acres—while nearly 50% are planted to soybeans and 35% to cotton, the entire thing feels orchestrated. It can sound like just one more stanza in the song played to generate more payments to paper over the problems.
Wiser minds than mine ask tougher questions. Often when they do, they echo words from the past. One example reflects back the words from a former economist in Roosevelt’s USDA who, looking back on it all in 1983, noted that the New Deal farm policy had converted agriculture to an “urban-industrial commercial conception and policy design” (Breimyer, 1983, at 334). Forty years later, questioners and critics point out how many commodities go into industrial products, industrialized food, and industrialized feeding operations, purchasing industrial inputs to make it all grow. Farm policy, however, stumbles along in a barely updated version of the New Deal system. When the profits run out or markets are damaged, the only responses remain demands for more payments rather than addressing the problems—the policy equivalent of pain killers.
Frustrated questions blend with troubled history to serve reminders that payments fix nothing. They do worse when they are little more than ill-conceived, barely disguised favors to favored factional interests. The problems and pains are real, very real. Nothing here is intended to diminish that. Today, farmers struggle to make a living, and consumers increasingly struggle to purchase food. Between the fields and the forks, great piles of money slosh around and change hands. We are justified in asking where all the money goes. Who profits from all the pain and discontent? Or maybe these are questions we would rather not ask.
References
Breimyer, Harold F. "Agricultural Philosophies and Policies in the New Deal." Minn. L. Rev. 68 (1983): 333. https://scholarship.law.umn.edu/cgi/viewcontent.cgi?article=2429&context=mlr.
Congressional Budget Office. “Details About Baseline Projections for Selected Programs: USDA Mandatory Farm Programs.” February 2026. https://www.cbo.gov/system/files/2026-01/51317-2026-02-usda.pdf.
Coppess, J. "Off Base, Part 1: Reviewing Issues and Problems with Base Acre Policy." farmdoc daily (16):7, Department of Agricultural and Consumer Economics, University of Illinois at Urbana-Champaign, January 15, 2026.
Coppess, J. "Off Base, Part 2: The View from the CBO Baseline." farmdoc daily (16):10, Department of Agricultural and Consumer Economics, University of Illinois at Urbana-Champaign, January 22, 2026.
Erden, Bora, Devon Lum, Helmuth Rosales, Elena Shao, Haley Willis and Ashley Wu. “Timeline: A Minute-by-Minute Look at the Shooting of Alex Pretti.” The New York Times. https://www.nytimes.com/interactive/2026/01/24/us/minneapolis-shooting-alex-pretti-timeline.html.
Frost, Robert. “An Old Man’s Winter Night.” https://poets.org/poem/old-mans-winter-night.
Ghaffar, Nazaneen “Another Weekend Winter Storm? Here’s How the Forecast Is Shaping Up.” The New York Times. January 27, 2026. https://www.nytimes.com/2026/01/27/weather/next-winter-storm-forecast-snow-ice.html.
Homans, Charles. “Watching America Unravel in Minneapolis.” The New York Times Magazine. January 25, 2026. https://www.nytimes.com/2026/01/25/magazine/minneapolis-trump-ice-protests-minnesota.html.
Inal, Kerem, Chris Looft, Jared Kofsky, and Josh Margolin. “Minneapolis ICE shooting: A minute-by-minute timeline of how Renee Nicole Good died.” ABC News. January 9, 2026, 3:07 PM https://abcnews.go.com/US/minneapolis-ice-shooting-minute-minute-timeline-renee-nicole/story?id=129021809.
Madison, James. “The Utility of the Union as a Safeguard Against Domestic Faction and Insurrection.” The Federalist No. 10. https://guides.loc.gov/federalist-papers/text-1-10#s-lg-box-wrapper-25493272.
Madison, James. “The Structure of the Government Must Furnish the Proper Checks and Balances Between the Different Departments.” The Federalist, No. 51. https://guides.loc.gov/federalist-papers/text-51-60#s-lg-box-wrapper-25493427.
NPR.org. “Bitter cold grips the eastern U.S. as storm deaths rise and power outages linger.” January 27, 2026. https://www.npr.org/2026/01/27/g-s1-107584/winter-storm-2026-deaths-power-outages.
Rucker, LaReeca and Rick Rojas. “Winter Storm Debilitates the South, Encasing Cities in Ice and Snow” The New York Times. January 26, 2026. https://www.nytimes.com/2026/01/26/weather/south-us-winter-storm-snow-ice.html.
Tuthill, Samantha-Rae. “Winter tales and myths: Where did Old Man Winter, Jack Frost come from?” Accuweather.com. December 17, 2014. https://www.accuweather.com/en/weather-news/winter-tales-and-myths-where-did-old-man-winter-jack-frost-come-from/89408.
Disclaimer: We request all readers, electronic media and others follow our citation guidelines when re-posting articles from farmdoc daily. Guidelines are available here. The farmdoc daily website falls under University of Illinois copyright and intellectual property rights. For a detailed statement, please see the University of Illinois Copyright Information and Policies here.