


Release of Insurance Evaluator with the New SCO and ECO
We have recently released a new Insurance Evaluator on the farmdoc website (https://fd-tools.ncsa.illinois.edu/evaluator). The revised tool takes into account recent increases in premium support for the Supplemental Coverage Option (SCO) and the Enhanced Coverage Option (ECO), as well as increases in support for the COMBO product (see farmdoc daily, June 10, 2025; January 27, 2026; February 3, 2026). As a result of these premium support changes, many farmers may consider taking ECO and SCO and potentially lowering RP coverage levels, particularly for soybeans in the central part of Illinois. The new tool illustrates the impacts of using SCO and ECO in conjunction with other crop insurance programs. Example results are shown for soybeans in McLean County, Illinois, the largest soybean-producing county in Illinois. Overall, many producers will find taking ECO at the 95% level an attractive alternative.
Insurance Evaluator
The Insurance Evaluator is a web-based tool jointly developed by the Department of Agricultural Economics (ACE) and the National Center for Supercomputing Applications (NCSA), both at the University of Illinois.
The Insurance Evaluator is available on the farmdoc website. It is under the Tools menu in the upper-right of farmdoc. Select “Crop Insurance Tools” and then “Crop Insurance Evaluator“. The following input screen will appear (see Figure 1).
Figure 1. Crop Insurance Evaluator Selection Menu
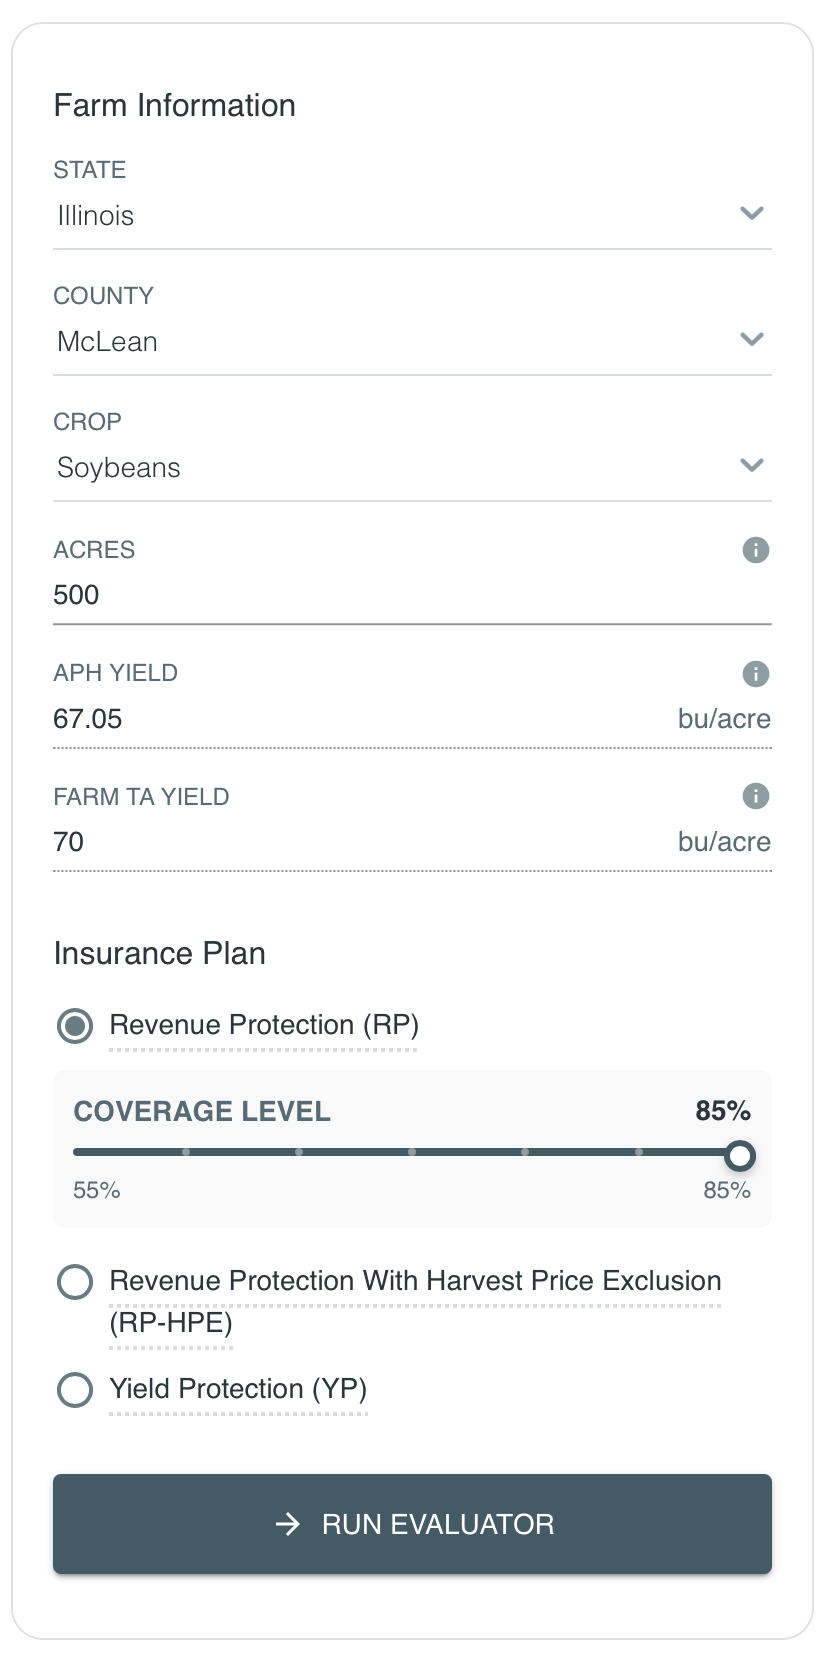
The Insurance Evaluator runs a simulation model for a case farm in the selected county. Results can be summarized for a county, crop, and insurance plan selection. Figure 1 shows a case for:
- The “STATE” selection of Illinois.
- The “COUNTY” selection of McLean County.
- The “CROP” is Soybeans.
- The “ACRES” is the farm insurance unit, set to 500 acres.
- The tool then populates an average Actual Production History (APH) yield and Farm Trend Adjusted (TA) yield. For McLean County, the APH yield is 67.05 bushels per acre, and the farm TA yield is 70 bushels per acre.
- Users can select from any of the three COMBO plan products (RP, RP with the Harvest price Exclusion (RP-HPE), or Yield Protection (YP)). In Figure 1, RP is selected with coverage level set to 85%.
Insurance Evaluator Results
At the bottom of the simulator, users can click “Run Evaluator” to run the simulation and generate results. Results will depend on the projected price, volatility factor and futures price. The official projected price and volatility factor will be used when released by the Risk Management Agency (RMA). Figure 2 shows the results for RP-85%, soybeans in McLean County (results will vary depending on updated prices):
Figure 2. Insurance Evaluator Results for Soybeans in McLean County, IL
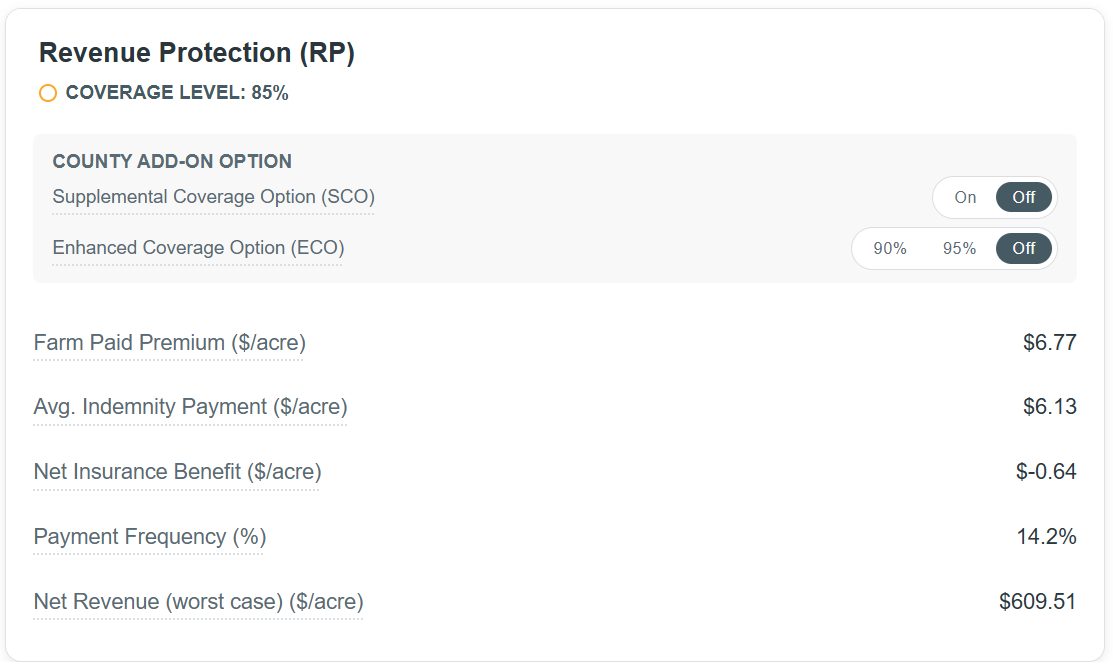
- Farmer-paid premium is $6.77 per acre. Farmer-paid premiums are for the case farm with 500 acres, an enterprise unit (which can be changed to a basic unit), a 67.05 bushel per acre APH yield, and a 70 bushel per acre TA yield.
- The average indemnity payment is $6.13. If 2026 could be repeated many times, the average identity payment would be $6.13 per acre, including many years with revenues above the guarantee and many years with $0 per-acre payment.
- The average net insurance benefit is -$.64 per acre. Net insurance benefit is the average indemnity payments ($6.13) minus farmer-paid premium ($6.77 per acre). Over many years, farmers should expect to pay out $.64 more per acre in insurance premiums than they receive in indemnities.
- The payment frequency is 14.2%. Our estimates suggest that farmers should expect to receive payments in 14.2% of years, thus not receiving payments in 85.8% of years. That is approximately one payment in every seven years. In six out of seven years, farmers would have paid $6.77 per acre and received no insurance payments. That is, the net benefit for those years is -$6.77 per acre.
- Net revenue for the crop in the worst case is $609.51 per acre. The Net Revenue (worst case) shows the revenue level at a 5% probability, meaning there is 5% chance of the revenue being below this amount. Another way to interpret it is as a one-in-twenty adverse year, assuming one outcome per year. Net revenue includes crop revenue plus net insurance benefits. From a risk management perspective, higher revenues with higher likelihood are preferred.
Comments on the results in Figure 2:
- Net benefits are negative. Given that the statute requires actuarial soundness, properly-rated crop insurance should have positive net benefits (see farmdoc daily, February 3, 2026). The negative net benefit in the evaluator’s projection indicates the premium set by RMA is too high. Loss experience suggests this for many areas of the Midwest (see farmdoc daily, July 16, 2024), particularly for soybeans (see farmdoc daily, January 17, 2023).
- In evaluating insurance scenarios, the tradeoff often is in a higher farmer-paid premium for higher “net revenue” in the worst case. That is, farmers must pay more to get better risk protection under adverse conditions.
SCO and ECO in the Insurance Evaluator
The One Big Beautiful Bill Act (OBBBA) increased premium subsidy on SCO from 65% to 80%, resulting in much lower farmer-paid premiums. By administrative decision, RMA also increased premium support for ECO to 80%. As a result, farmers should consider SCO and ECO as they make crop insurance decisions in 2026 (see farmdoc daily, February 3, 2026).
Note that SCO and ECO can be evaluated using the Insurance Evaluator. In Figure 2, there are two buttons in the “County Add-on Option” box, one for SCO and one for ECO. A user of the Insurance Evaluator can get all combinations of SCO and ECO, given the COMBO product at the selected coverage level. For the RP-85% product shown in Figure 2, clicking the SCO and ECO buttons will generate the following:
- Selecting SCO will add SCO from coverage 86% to 85%, the selected coverage level of RP.
- Selecting the ECO 90% button adds ECO county coverage from 90% down to 86%, the beginning of SCO coverage.
- Selecting the ECO 95% button adds ECO county coverage from 95% down to 86%, the beginning of SCO coverage.
For the 85% RP policy, five different alternatives of county coverage above the farm-level coverage are available:
- SCO, providing coverage from 86% to 85%.
- SCO plus ECO 90%, providing county coverage from 90% to 85%.
- SCO plus ECO 95%, providing county coverage from 95% to 85%.
- ECO 90% without SCO, providing county coverage from 90% to 86%, leaving the 86% to 85% band uncovered.
- ECO 95% without SCO, providing county coverage from 95% to 86%, again leaving the 86% to 85% band uncovered.
Figure 3 illustrates the addition of SCO to an RP policy with 85% coverage. The following changes occur:
- Farmer paid premiums with SCO increases to $7.04, a marginal increase of $.27 per acre over the premium without SCO of $6.77 per acre.
- Net insurance benefits increase to $0 per acre, up from -$.64 without SCO.
- Payment frequency increased to 18.3%, up from 14.2% without SCO.
- Net revenue (worst case) is $613.49 per acre, an increase from $609.51 without SCO.
Figure 3. RP-85% plus SCO coverage for soybeans in McLean County, IL
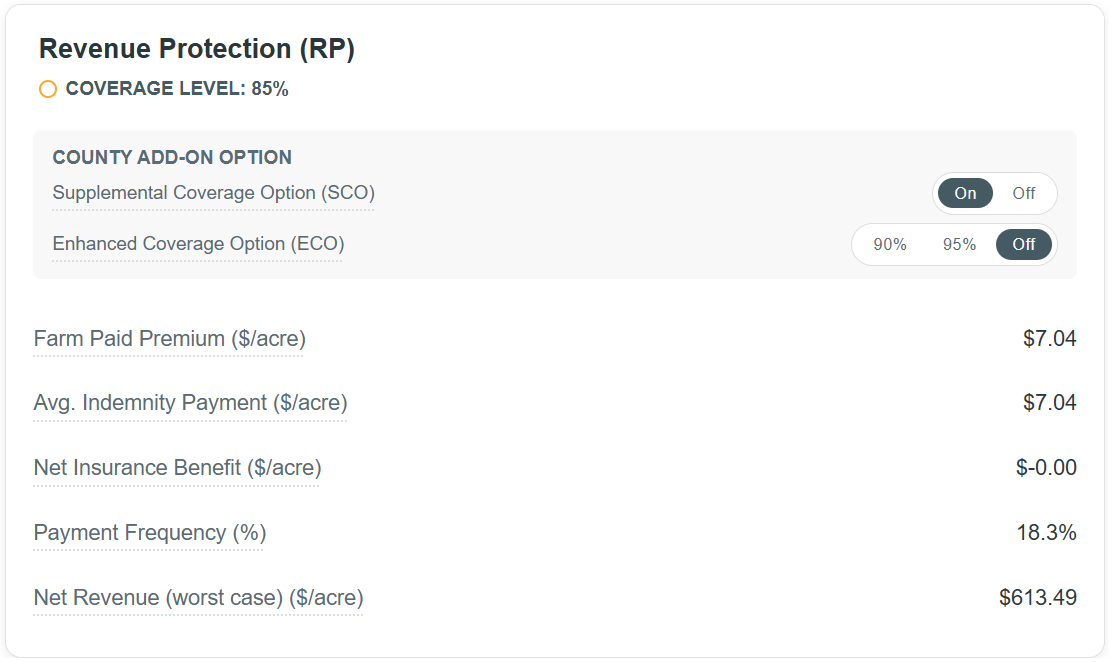
As one would expect, the small 86%-85% payment band has a modest impact on insurance premiums and risk benefits.
Compare Mode and ECO
The Insurance Evaluator has a “Compare Mode” that allows multiple comparisons to be made simultaneously. The comparison mode is shown in Figure 4, in which ECO is added to an RP-85% policy. In Figure 4, RP-85% without ECO is shown on the left panel. RP-85% with ECO at a 90% coverage is shown in the center panel, and RP-85% with ECO at the 95% is shown in the right panel. The scenarios in Figure 4 do not include SCO.
Figure 4. Compare Mode, RP-85% with and without ECO for soybeans in McLean County, IL
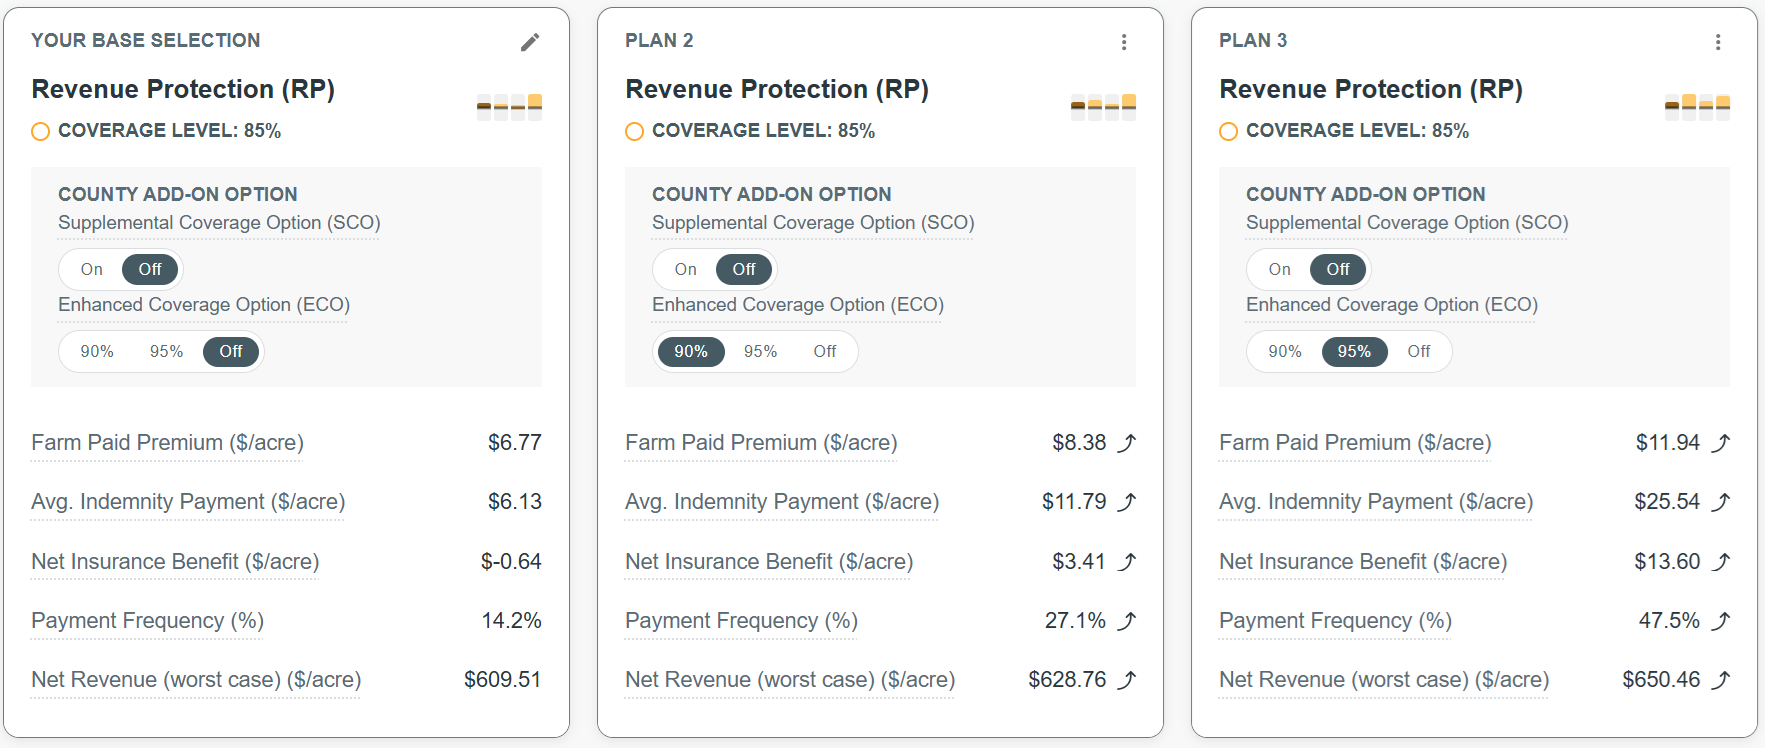
Net insurance benefit increases from $-.64 to $3.41 with ECO at the 90% coverage level, and $13.60 with ECO at the 95% coverage level. Net revenue (worst case) goes up from $609.51 without ECO to $628.76 with ECO at the 90% coverage level, and $650.46 with ECO at the 95% coverage level. Farmer-paid premium also increases from $6.77 without ECO to $8.38 with ECO 90%, and $11.94 with ECO 95%. Probability of triggering a payment also increases as ECO coverage increases.
Lowering RP Coverage Levels
With extremely tight margins, many farmers are looking for ways to reduce costs in the upcoming year. One way to do this with crop insurance is to lower the coverage level on RP and then use SCO and ECO. Note that the trade-off in doing so is that risk protection will be lowered for farm-level events caused by lower yields on the farm. However, including ECO and SCO will increase coverage for price and yield decreases occurring over wider areas. The ability of farmers to use county-level products to cover individual losses depends on the correlation between their own yields, county yields and prices.
To assess this strategy’s impact on risks, the “Compare Mode” in the Insurance Evaluator was used to evaluate RP scenarios at 60% coverage against the base selection of 85% coverage. The alternatives are shown in Figure 5 (differences to base scenario can toggled on in the upper-right corner of each alternative). The base selection is RP-85%, and the others are RP-60% with and without SCO and ECO. Three of those alternatives have higher risk benefits than RP at an 85% coverage level. These are at the bottom row. In rank order, those alternatives are:
Figure 5. Compare mode: RP-85% vs. RP-60% with and without SCO/ECO for soybeans, McLean County, IL
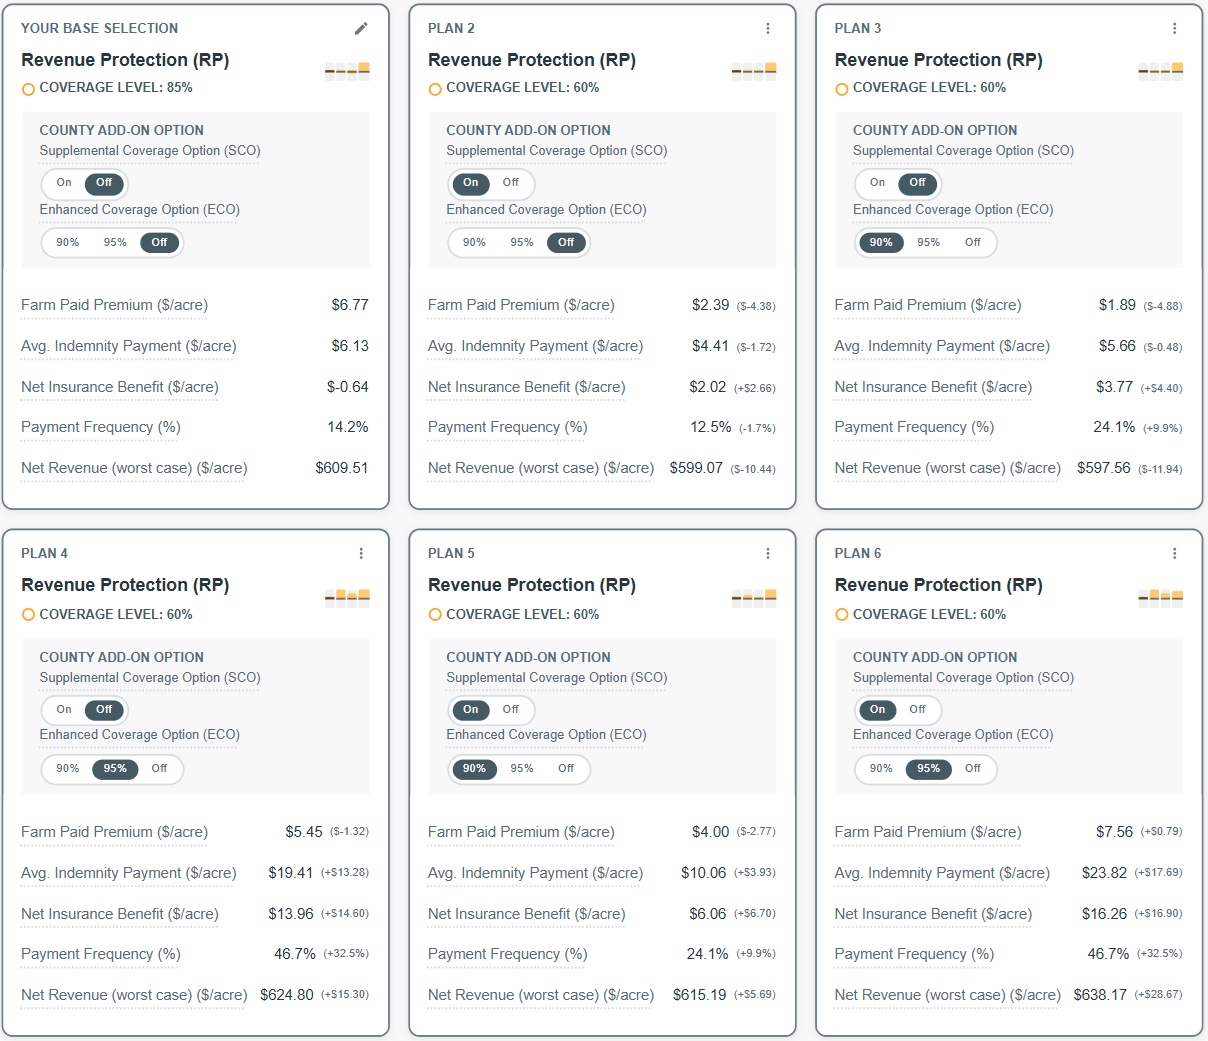
- Plan 6 (bottom-right corner): ECO from 95% to 86% county coverage, SCO with county coverage from 86% to 60%, and RP with farm-level coverage beginning at 60%. This combination has a $638.17 net revenue (worst case). The $638.17 net revenue (worst case) is $28.67 above RP-85%. The farmer-paid premium, however, is $7.56 per acre, only $0.79 per acre above the $6.77 for RP-85%.
- Plan 4 (bottom-left corner): ECO from 95% to 86% county coverage and RP-60% (no SCO). The net revenue (worst case) is $624.80, $15.30 above $609.51 for RP-85% alone. In addition, this combination has a lower farmer-paid premium of $5.45, versus $6.77 for RP-85%.
- Plan 5 (bottom-center): ECO from 90% to 86% and SCO coverage from 86% to 60%, and RP-60%. This combination has a net revenue (worst case) of $615.19 and a farmer paid premium of $4.00 per acre versus $6.77 for RP-85%.
Summary and Discussion
The Insurance Evaluator layout has been changed to facilitate comparisons of SCO and ECO in conjunction with other insurance choices. Also, lowering RP coverage levels can reduce farmer-paid premiums. When making those decisions, however, some additional considerations are warranted:
- Adding ECO often has more risk benefits than does SCO. Triggering policies with 90% and 95% happens more often than at lower coverage levels. Consider adding ECO, particularly at a 95% coverage level.
- Lowering RP coverage levels and adding county-level products often has the same risk benefits (net revenue (worst case) remains at similar levels). That result does not mean that the different combination of products will pay in the same situation or provide the same risk coverage. County-level revenue products will pay when county revenue falls, either through lower prices, lower yields, or a combination of both. County-level products will not pay if an individual’s farm has a yield decline not accompanied by a sufficient county-level yield decline. Farmers who are more concerned with protecting low yields, or that have yields variation that do not match their counties variation, will likely prefer a higher level of the RP product. On the other hand, farmers who are more concerned with the widespread yield falls are likely to prefer ECO and SCO.
- Farms concerned with prevent plant risks likely should not reduce their COMBO product coverage, as doing so will reduce prevent plant payments. Prevent plant protection is not available with county products.
- The timing of payments is different from individual to county level products. ECO/SCO payments are only made after official county yields are released in the following June, rather than after harvest, as usually the case for RP.
Net benefits increase for switching from RP to ECO and SCO for two reasons. First, loss experience has been extremely low in the productive parts of the Midwest, and premiums are relatively high compared to payouts. Second, percent premium subsidy declines with higher levels of RP coverage. The lower percent premium subsidy at higher individual farm insurance coverage levels introduces an incentive to lower RP coverage levels in the presence of add-up area insurance. Third, for most part of the Midwest, production is relatively homogeneous with regards to yields. Thus, on average, farms tend to have a moderate to high yield correlation with their county yields. We will explore this topic in up-coming articles.
We show net benefits to be positive for SCO and ECO. Historically, SCO and ECO have paid in a few situations in Illinois (see farmdoc daily, July 11, 2023). Recent increases in expected yields aid in remedying the situation (see farmdoc daily, January 27, 2026), and those increases are included in simulator results, but loss ratios are still well below the .88 target (see farmdoc daily, February 3, 2026). If rated properly, SCO and ECO net benefits should be larger in the Midwest. Loss ratios have been extremely low for county-level products. Lowering premiums so that target loss ratios are closer to one would increase benefits.
Finally, many farmers will find ECO and SCO a good risk management tool. ECO 95% will provide additional benefits in many cases. SCO has fewer benefits. For many farmers, taking ECO 95% and lowering the RP coverage level will lower farmer-paid premium costs, but risk benefits must be taken into account.
References
Schnitkey, G., B. Sherrick, C. Zulauf, N. Paulson and J. Coppess. "The House Reconciliation Bill Proposal for SCO: Income Support for High-Risk Farmland." farmdoc daily (15):106, Department of Agricultural and Consumer Economics, University of Illinois at Urbana-Champaign, June 10, 2025.
Schnitkey, G., B. Sherrick, C. Zulauf, J. Coppess and N. Paulson. "Crop Insurance Loss Performance in Illinois and the Midwest." farmdoc daily (14):131, Department of Agricultural and Consumer Economics, University of Illinois at Urbana-Champaign, July 16, 2024.
Schnitkey, G., C. Zulauf, N. Paulson and J. Baltz. "Crop Insurance for Soybeans: The Low Loss Ratio Concern." farmdoc daily (13):8, Department of Agricultural and Consumer Economics, University of Illinois at Urbana-Champaign, January 17, 2023.
Schnitkey, G., H. Monaco, N. Paulson, C. Zulauf and B. Sherrick. "Expected Yields for SCO and ECO in Illinois." farmdoc daily (16):12, Department of Agricultural and Consumer Economics, University of Illinois at Urbana-Champaign, January 27, 2026.
Schnitkey, G., N. Paulson, C. Zulauf and J. Baltz. "Frequency of SCO and ECO Payments in Illinois." farmdoc daily (13):127, Department of Agricultural and Consumer Economics, University of Illinois at Urbana-Champaign, July 11, 2023.
Schnitkey, G., N. Paulson, C. Zulauf, H. Monaco and B. Sherrick. "SCO and ECO Choices in 2026." farmdoc daily (16):16, Department of Agricultural and Consumer Economics, University of Illinois at Urbana-Champaign, February 3, 2026.
Disclaimer: We request all readers, electronic media and others follow our citation guidelines when re-posting articles from farmdoc daily. Guidelines are available here. The farmdoc daily website falls under University of Illinois copyright and intellectual property rights. For a detailed statement, please see the University of Illinois Copyright Information and Policies here.