


Flipping the Pyramid: Public Perceptions of New Dietary Guidelines
Introduction
The Dietary Guidelines for Americans (DGA), which are jointly released by the US Department of Agriculture and the US Department of Health and Human Services every five years, serve as an important guide for the nation’s diet. The DGAs provide recommendations for what to eat and drink to meet nutrient needs, promote health, and prevent disease. The guidelines are also used to update nutrition standards of federal programs such as the National School Lunch Program.
This January, the 2025-2030 DGAs were released. While many of the recommendations remained consistent with the previous version (e.g., eat plenty of fruits and vegetables, prioritize whole grains), the new DGAs were much shorter, were accompanied by a new graphic with the title “Eat Real Food” (see Figure 1) that replaces the previous MyPlate graphic, and launched the government website, realfood.gov. The DGAs also had some notable changes, including an increased emphasis on consumption of proteins and full-fat dairy products, criticism of highly processed foods, and more emphasis on reducing added sugars (for a more complete discussion of changes, see Mozaffarian, 2026).
Of the updates, USDA Secretary Brooke Rollins, noted, “we are realigning our food system to support American farmers, ranchers, and companies that grow and produce real food … that means more protein, dairy, vegetables, fruits, healthy fats, and whole grains on American dinner tables” (USDA, 2026a). The new DGAs were even featured during this year’s Super Bowl. The game, which averaged 124.9 million viewers, included a 30-second commercial from the privately-funded MAHA Center Inc., which featured Mike Tyson criticizing processed foods and directed consumers to realfood.gov, which hosts the updated DGAs. This is particularly notable as research has shown that media coverage and public awareness of previous DGAs has been low (e.g., Brown, et al., 2011; Epstein, et al., 2013; Wambogo, et al., 2022; Kinderknecht, et al., 2024; Killion, et al., 2024).
Figure 1. New Imagery Associated With the Recently Updated DGA
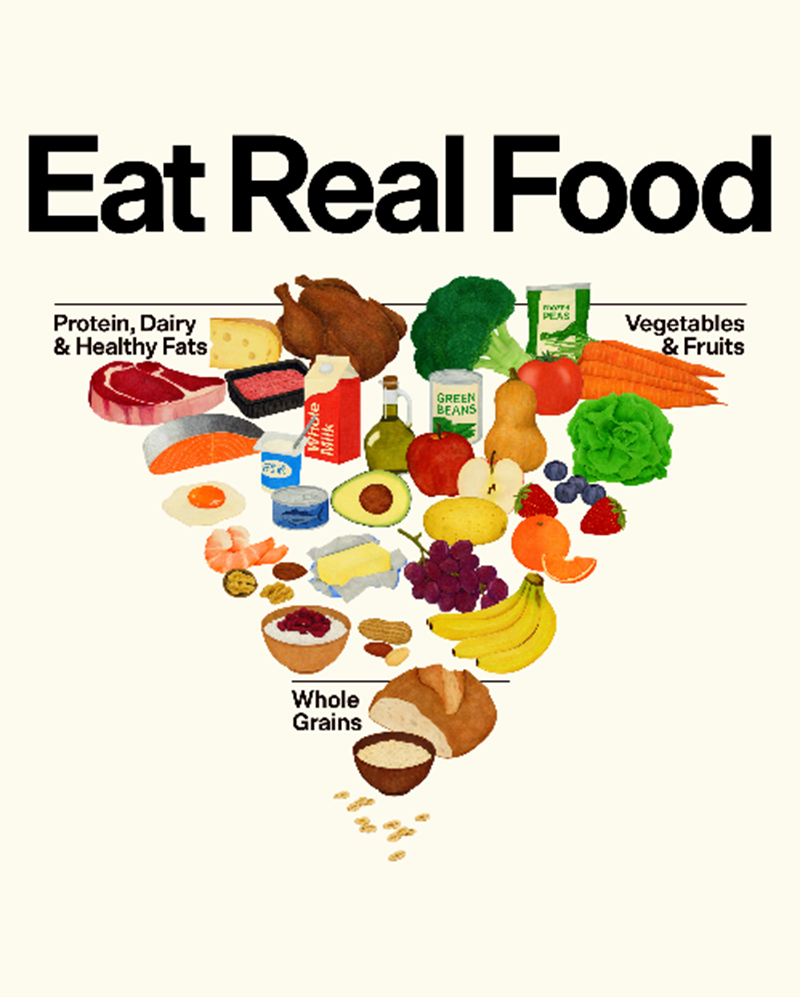
Image Source: 2026 White House press release
In this post, we use results from the Gardner Food and Agricultural Policy Survey (GFAPS) to assess public perceptions of the new DGAs – including beliefs about whether following the recommendations are important for health, realistic, and affordable. We also discuss current levels of adherence to recommendations, parental perceptions of recommendations for young children, and perceptions of affordability across household income groups.
Methods
The Gardner Food and Agricultural Policy Survey (GFAPS) is an online survey aimed at assessing public perceptions of ongoing food and agricultural issues. Participants are recruited quarterly via Qualtrics Panels in an effort to match the US population in terms of gender, age, income, and region. Each wave includes approximately 1,000 US adult participants. In this post, we review public perceptions of DGAs using results from the sixteenth wave of GFAPS, which was conducted in February 2026.
Specifically, we explore public perceptions of eight recommendations from the new DGAs:
- Eat the right amount for you. (Note: The calories you need will depend on your age, sex, height, weight, and level of physical activity.)
- Prioritize protein foods at every meal.
- Consume dairy.
- Eat vegetables and fruits throughout the day.
- Incorporate healthy fats. (Note: Healthy fats are plentiful in many whole foods, such as meats, poultry, eggs, omega-3–rich seafood, nuts, seeds, full-fat dairy, olives, and avocados.)
- Focus on whole grains.
- Limit highly processed foods, added sugars, and refined carbohydrates.
- Limit alcoholic beverages.
The DGAs also included additional recommendations for specific groups, including some for children ten years and younger. For the participants with children in this age range (n=238, 23.2%), we asked about three recommendations: (1) no amount of added sugars is recommended, (2) full-fat dairy products are important for children to help meet energy needs and support brain development, and (3) avoid caffeinated beverages. All recommendations are drawn directly from the DGA document. Additional details on serving sizes can be found in the DGA’s Daily Servings Guide.
Prior to asking participants about their perceptions of the DGA recommendations, they were provided basic background information on the DGAs (see endnote 1 for text). In our sample, 48.2% indicated that prior to the survey they were aware that the DGAs had been updated in January 2026, and 56.7% indicated that they had seen the new image associated with the updated DGAs (see Figure 1). This suggests that awareness of new DGAs appears higher than previous versions (e.g., Brown, et al., 2011; Wambogo, et al., 2022; Kinderknecht, et al., 2024; Killion, et al., 2024). Among those who were aware of the DGA update, the most common sources of information were news media (70.1%) and social media (41.6%).
Participants were then asked about their perceptions of the DGA recommendations. Participants were asked to consider how each recommendation would affect their household’s food choices. For each recommendation, participants were asked the extent to which they agreed or disagreed that following the recommendation was (1) important for the health of their household, (2) realistic for their household, and (3) affordable for their household. Participants could respond with either strongly agree, somewhat agree, somewhat disagree, or strongly disagree. For “limit alcoholic beverages” we only investigate whether the recommendation was thought to be important and realistic. In this post, we focus primarily on a combined agree category (either strongly or somewhat); however, tables with the more detailed responses can be found at the end of the post in Appendix tables.
For participants with children 10 years or younger, they were asked whether following the children-specific recommendations were important for the health of the children in their household, realistic for their household, and affordable for their household. The order of both overall and child-specific recommendations was randomized to prevent ordering effects (ordering effects refer to the fact that the order of questions can affect responses).
In addition to their perceptions of the DGAs, participants were asked to consider how often their household’s current eating habits followed each recommendation (always, often, sometimes, rarely, or never). Parents of young children were also asked about how often their children’s current eating habits followed the child-specific recommendations.
Online surveys are not probability samples, and thus, are limited by sample bias. For example, our sample over-represents those with a bachelor’s degree (43.7% vs. 35.7% nationally, per the most recent US Census) and characteristics such as education can be related to measures of interest (e.g., perceptions or adherence to DGAs), which may affect our estimates. Additionally, surveys can be subject to social desirability bias, where participants may overreport behaviors or perceptions they feel are “good” or “right” and underreport behaviors or perceptions they feel are “bad” or “wrong”. For example, previous research has shown people tend to underreport poor health habits, including some food choices (e.g., Hebert, et al., 1995; Noia, et al., 2016; Widmar, et al., 2016). These results provide an initial look at perceptions of the updated DGAs.
Finally, as the appropriateness of different sources of fats has been contentious (e.g., Semuels, 2025; Todd, 2025), we also asked about a supportive detail of the healthy fats’ recommendation (“When cooking with or adding fats to meals, prioritize oils with essential fatty acids, such as olive oil. Other options can include butter or beef tallow.”). We will discuss these results in a future post.
Results
Figure 2 shows the proportion of participants who agreed, either strongly or somewhat, that following each DGA recommendation was important for the health of their household (shown in blue) and realistic for their household (shown in orange). Broadly, participants agreed that the new DGAs were important for their health, with over 80% of participants agreeing to each recommendation. Here, we find that “eat vegetables and fruits throughout the day” was most strongly supported, with 94.5% agreeing and 62.2% strongly agreeing that following this recommendation was important for the health of their household (see Appendix Table A1 for details). This is in line with our analysis of the previous DGA recommendations (farmdoc daily, December 11, 2025), which found high levels of public agreement.
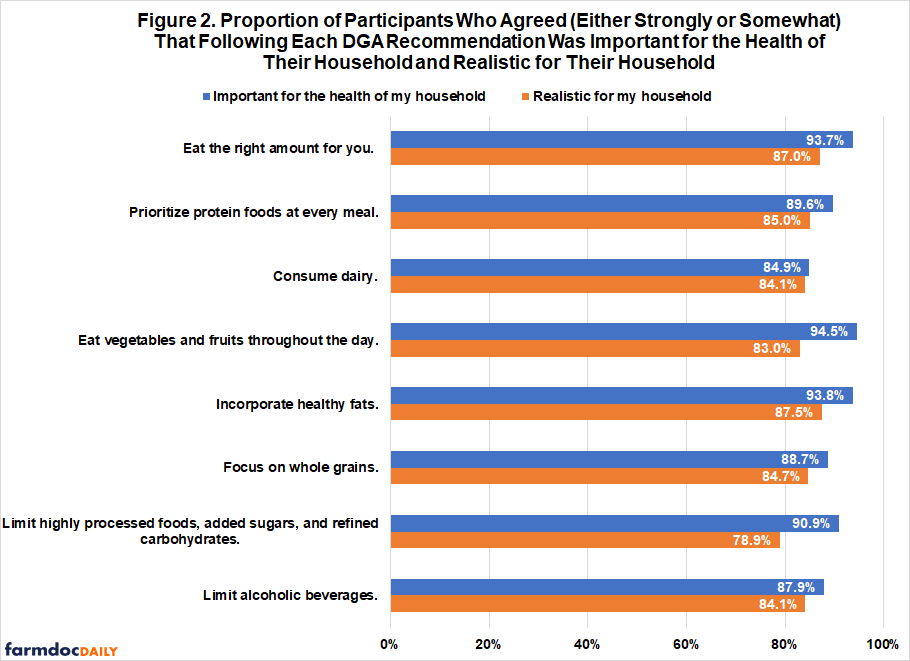
In addition to broad agreement with the importance of new DGA’s recommendations, participants agreed at high rates that following the guidelines was realistic, with over 75% saying they agreed (either strongly or somewhat) that following each recommendation was realistic for their household (see Figure 2). Comparing differences between perceptions of importance for health and realism in implementation highlights areas where consumers may need additional support. We find the largest difference for the recommendation “limit highly processed foods, added sugars, and refined carbohydrates,” with 90.9% agreeing that following the recommendation was important for the health of their household and 78.9% agreeing it was realistic for their household. We also see a large difference for the recommendation “eat vegetables and fruits throughout the day,” with 94.5% agreeing that following the recommendation was important for the health of their household and 83.0% agreeing that following the recommendation was realistic for their household.
Importantly, while we find both broad agreement from participants that the DGAs are important for their health and realistic for their household, research has shown that few Americans’ diets meet the recommendations (e.g., Stewart et al., 2025; Lee, et al., 2022; Rehm, et al., 2016; Brady, et al., 2000). In our sample, a minority indicated they always followed each recommendation (see Table 1). Differences between perceptions of realism and frequency in current adherence may suggest misunderstanding DGAs, optimism or overstating one’s capacity, need for additional support, and more. We find that participants indicated that the recommendation they most adhered to was “limit alcoholic beverages”. About half of participants indicate that they always or often “limit highly processed foods, added sugars, and refined carbohydrates.” This is in line with a recent survey of over 40,000 US residents that found 45% of consumers report considering added sugars when choosing what foods to buy or eat (Gustafson and Rose, 2023). Only 29.1% of participants indicated they always followed the recommendation “eat vegetables and fruits throughout the day”. This is higher than a recent USDA evaluation of adult consumption of fruits (2017-2020), which found that 23% consumed more than 75% of their daily recommended fruits and only 15% consumed 100% of their daily recommended fruits (Stewart, et al., 2025).
Table 1. Frequency in Which Participants Said They Follow Each DGA Recommendation
| Always | Often | Sometimes | Rarely | Never | |
| Eat the right amount for you. Note: The calories you need will depend on your age, sex, height, weight, and level of physical activity. |
25.7% | 37.5% | 28.6% | 7.0% | 1.2% |
| Prioritize protein foods at every meal. | 26.0% | 38.6% | 27.3% | 6.7% | 1.4% |
| Consume dairy. | 27.2% | 38.8% | 24.7% | 7.8% | 1.6% |
| Eat vegetables and fruits throughout the day. | 29.1% | 29.8% | 28.6% | 9.7% | 2.8% |
| Incorporate healthy fats. Note: Healthy fats are plentiful in many whole foods, such as meats, poultry, eggs, omega-3–rich seafood, nuts, seeds, full-fat dairy, olives, and avocados. |
18.1% | 37.0% | 37.4% | 6.0% | 1.5% |
| Focus on whole grains. | 20.7% | 32.3% | 32.0% | 12.7% | 2.2% |
| Limit highly processed foods, added sugars, and refined carbohydrates. | 23.0% | 28.6% | 33.4% | 12.0% | 3.1% |
| Limit alcoholic beverages. | 43.9% | 25.6% | 19.6% | 8.0% | 2.9% |
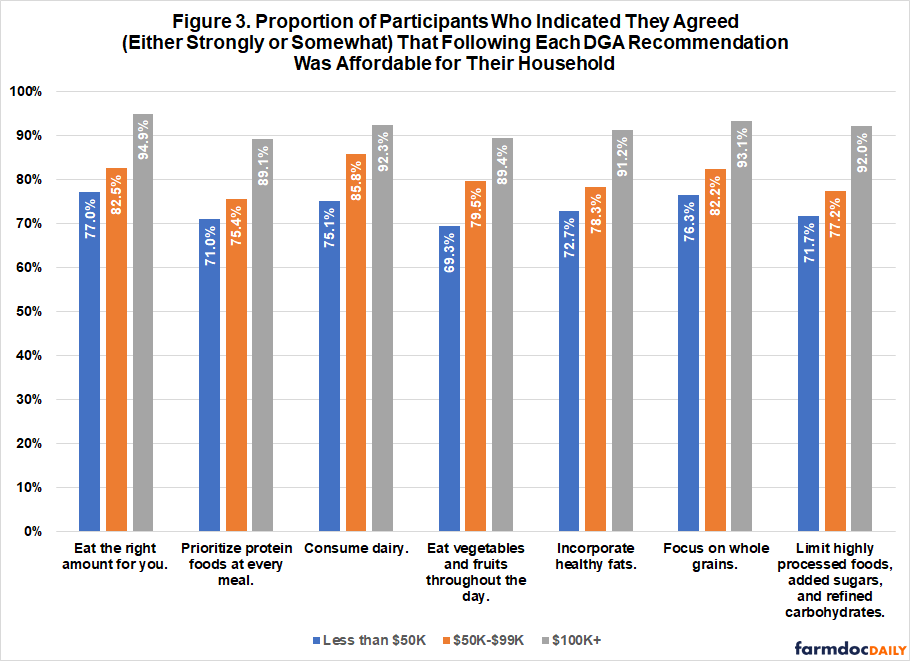
While there can be many different hurdles to healthy eating – including inadequate time to shop or cook, limited cooking knowledge, limited access to healthful ingredients, and limited access to a kitchen or tools – an important limitation can be cost (CFDAS, 2025; Kikuchi et al., 2025). The Secretary of the USDA penned an op-ed entitled Healthy and affordable food is within reach for all Americans, highlighting this issue and underscored that research from the USDA found that meals could be purchased for as little as $3 per meal (Rollins, 2026). News reports highlight that economists agree that choosing meals that comply with the updated DGAs can be done in a cost-effective manner, yet balancing health and cost can also require time and know-how (e.g., Todd, 2026; Mitovich et al., 2026). Here, we find that over 75% of participants agreed (either strongly or somewhat) that following the recommendations was affordable for their household (see Appendix Table A3 for details). Agreement about affordability was highest for the recommendation to “eat the right amount for you” and lowest for “prioritize protein foods at every meal.”
Figure 3 shows the proportion of participants across income groups who agreed that each recommendation is affordable for their household. Importantly, the majority of participants in all three income groups agreed (either strongly or somewhat) that following each recommendation was affordable for their household. Despite substantial recent discussion of affordability of some proteins, such a beef and eggs (e.g., Thomas, 2026; Nelson, 2025), we find that over 65% of participants in each income group indicated they thought the recommendation “prioritize protein foods at every meal” was affordable. Still, participants with higher incomes were more likely to indicate each recommendation was affordable compared with participants with lower incomes. These differences were largest for two recommendations. We find a 20-percentage point gap between the lower income group (less than $50,000) and the higher income group ($100,000 or more) in agreement on whether “eating vegetables and fruits throughout the day” and “limiting processed foods, added sugars, and refined carbohydrates” are affordable for their households, suggesting need for additional support for low-income households.
In terms of recommendations for young children, we find that the majority of participants with children 10 years and under agreed (either strongly or somewhat) that the recommendations were important for the health of their children. Specifically, 94.1% agreed that following the recommendation “no amount of added sugar is recommended” was important, 95.8% agreed that following the recommendation “full-fat dairy products are important for children to help meet energy needs and support brain development” was important, and 91.2% agreed that following the recommendation “avoid caffeinated beverages” was important.
As with adult recommendations, we find high levels of agreement that the recommendations for young children were both realistic and affordable and lower levels of current compliance. Most participants with children 10 years and younger indicated they agreed, either strongly or somewhat, that following the recommendations were realistic (added sugar, 86.1%; full-fat dairy, 92.9%; and caffeinated beverages, 89.9%) and affordable (added sugar, 92.4%; full-fat dairy, 89.5%; and caffeinated beverages, 89.9%) and fewer indicated their children always followed the recommendation (added sugar, 35.3%; full-fat dairy, 46.6%; and caffeinated beverages, 43.7%).
While stricter recommendations for children’s consumption of added sugars were applauded by in many public health, the recommendation has also been criticized by some parent organizations. A recent Politico article shares the tensions in an article entitled, Parents on RFK Jr.’s advice on sweets: ‘Completely unrealistic’ (Paun and Yarrow, 2026). Although we find lower rates of both current adherence and perceptions of realism for this recommendation (compared to the other recommendations for young children), we still find that the majority of participants with children 10 and younger agreed the recommendation was realistic for their household. Given the ubiquity of added sugars in food and drinks and the absolute nature of the recommendation, this is particularly surprising. This may suggest limited understanding of the recommendation, indeed, previous research has highlighted that dietary guidelines can be misinterpreted (e.g., Chea and Mobley, 2020). It may also suggest confusion about levels of added sugars in products they consume. For example, a recent survey highlighted that US consumers cite difficulty identifying which products are healthy as a top barrier to eating well (CFDAS, 2025) and some research has noted confusion in consumer interpretation relating to added sugar in products (Prada, et al., 2021; Gupta, et al., 2018; Tierney, et al., 2017; Patterson, et al., 2012).
Conclusions
This January, the Dietary Guidelines for Americans (DGAs) were updated, including the release of a new inverted food pyramid (see Figure 1). While these recommendations are consistent with the previous DGAs in many ways, the new recommendations are more critical of highly processed foods and added sugars, increase the emphasis on proteins (in particular animal proteins) and full-fat dairy products, and avoid numeric limits for alcohol (Mozaffarian, 2026). In this post, we use results from the most recent wave of the Gardner Food and Agricultural Policy Survey (GFAPS) to assess perceptions of the new DGAs.
We find that the majority of participants agreed that following each of the recommendations was important to the health of their household, with strongest support for the recommendation to “eat vegetables and fruits throughout the day.” We also find that most participants indicated following the recommendations was both realistic and affordable for their household, although lower rates of participants indicated their diets currently adhere to the recommendations. Perceptions of affordability differed across income groups, with lower income groups expressing lower rates of agreement than higher income groups, in particular for the recommendations “limit highly processed foods, added sugars, and refined carbohydrates” and “eat vegetables and fruits throughout the day.” Among participants with young children, most found the recommendations for children 10 years and younger important for the health of their children, realistic, and affordable. However, as with adult recommendations, fewer indicated their children currently adhere to the recommendations.
While public perceptions of DGAs have important implications for the food system, the recommendations also have substantial implications for federal programs. For example, the US Food and Nutrition Service bases the content of WIC nutrition education materials on the DGAs, School Nutrition Standards are based on the DGAs and will need to be revised (note, however, that updates for the previous (2020-2025) DGAs are not yet fully in effect), and more. Additionally, the new DGA priorities may be reflected in state and federal changes to programs. For example, shortly after the release of the DGAs the Whole Milk for Healthy Kids Act was signed into law, which allows schools in the NSLP to offer whole milk options at lunch (USDA, 2026b). Similarly, even prior to release of the new DGAs, the USDA began allowing states to make changes aligned with the DGAs by restricting foods that can be purchased with SNAP benefits, such as soda and candy. Together, changes to these programs are expected to have far reaching effects on food purchases and consumption.
References
Brady, L. M., Lindquist, C. H., Herd, S. L., & Goran, M. I. (2000). Comparison of children’s dietary intake patterns with US dietary guidelines. British Journal of Nutrition, 84(3), 361–367. doi:10.1017/S0007114500001641
Brown, KA., Timotijevic, L., Barnett, J., Shepherd, R., Lähteenmäki, L., and Raats, MM. (2011). A Review of Consumer Awareness, Understanding and Use of Food-Based Dietary Guidelines. British Journal of Nutrition. 106(1): 15–26. https://doi.org/10.1017/S0007114511000250
Center for Food Demand Analysis & Sustainability [CFDAS]. (2025). Perceived cost and taste hinder healthy food choices for many. Accessed via: https://ag.purdue.edu/cfdas/data/perceived-cost-and-taste-hinder-healthy-food-choices-for-many/
Chea, M., and Mobley, A. R. (2020). Interpretation and Understanding of the Dietary Guidelines for Americans Consumer Messages Among Low-Income Adults. Journal of the American College of Nutrition, 39(1), 63–71. https://doi.org/10.1080/07315724.2019.1610918
Ellison, B., Kalaitzandonakes, M., Muth, M., and Coppess, J. (2025). "Dietary Guidelines for Americans: What They Are and What Consumers Want Them to Be." farmdoc daily (15):228, Department of Agricultural and Consumer Economics, University of Illinois at Urbana-Champaign, December 11, 2025. Accessed via: https://farmdocdaily.illinois.edu/2025/12/dietary-guidelines-for-americans-what-they-are-and-what-consumers-want-them-to-be.html
Epstein SB, Jean-Pierre K, Lynn S, and Kant AK. (2013). Media Coverage and Awareness of the 2010 Dietary Guidelines for Americans and MyPlate. American Journal of Health Promotion. 28(1):e30-e39. doi:10.4278/ajhp.120420-QUAL-213
Gupta, A., Smithers, LG., Harford, J., Merlin, T., and Braunack-Mayer, A. (2018). Determinants of knowledge and attitudes about sugar and the association of knowledge and attitudes with sugar intake among adults: A systematic review. Appetite. 126. https://doi.org/10.1016/j.appet.2018.03.019.
Gustafson, CR. and Rose, DJ. (2023). Consideration of nutrients of public health concern highlighted in the Dietary Guidelines for Americans 2020–2025 among a large sample of US primary shoppers, Appetite. 181. https://doi.org/10.1016/j.appet.2022.106399.
Hebert, JR., Clemow, L., Pbert, L., Ockene, IS., Ockene, JK. (1995). Social Desirability Bias in Dietary Self-Report May Compromise the Validity of Dietary Intake Measures, International Journal of Epidemiology. 24(2): 389–398, https://doi.org/10.1093/ije/24.2.389
Kikuchi, E., Pula, I., Tyson, A., and Yam, E. (2025). Americans on Healthy Food and Eating. Pew Research. Accessed via: https://www.pewresearch.org/science/2025/05/07/americans-on-healthy-food-and-eating/
Killion, KE., Gaiser, J., Soucy, A., Waring, ME. (2024). Awareness and Use of MyPlate Among US Adults With Young Children. Journal of Nutrition Education and Behavior. 56(11): 822-828. https://doi.org/10.1016/j.jneb.2024.06.014.
Kinderknecht, KL., The, NS., Slining, MM. (2024). Whose Plate Is It? Awareness of MyPlate Among US Adults Over Time Since Implementation, Journal of the Academy of Nutrition and Dietetics. 124(9): 1214-1221. https://doi.org/10.1016/j.jand.2024.03.011.
Lee SH, Moore LV, Park S, Harris DM, Blanck HM. (2022). Adults Meeting Fruit and Vegetable Intake Recommendations — United States, 2019. MMWR Morb Mortal Wkly Rep. 71:1–9. DOI: http://dx.doi.org/10.15585/mmwr.mm7101a1
Mitovich, J. (2026). We Went Shopping for the $3 Dinner—and Actually Found It. The Wall Street Journal. Accessed via: https://www.wsj.com/economy/consumers/usda-agriculture-secretary-meal-cost-e1bdb4f4
Mozaffarian D. (2026). The 2025-2030 Dietary Guidelines for Americans. JAMA. 335(7):575–577. doi:10.1001/jama.2026.0283
Nelson, B. (2025). Egg Prices Continue Setting Records. Farm Bureau. Accessed via: https://www.fb.org/market-intel/egg-prices-continue-setting-records
Noia, JD., Cullen, KW., Monica, D. (2016). Social Desirability Trait Is Associated with Self-Reported Vegetable Intake among Women Enrolled in the Special Supplemental Nutrition Program for Women, Infants, and Children, Journal of the Academy of Nutrition and Dietetics. 116(12): 1942-1950. https://doi.org/10.1016/j.jand.2016.07.008.
Patterson, N.J., Sadler, M.J. and Cooper, J.M. (2012), Consumer understanding of sugars claims on food and drink products. Nutrition Bulletin, 37: 121-130. https://doi.org/10.1111/j.1467-3010.2012.01958.x
Paun, C. and Yarrow, G. (2026). Parents on RFK Jr.’s advice on sweets: ‘Completely unrealistic’. Politico. Accessed via: https://www.politico.com/news/2026/01/10/rfk-sugar-dietary-guidelines-children-00720472
Prada, M., Godinho, CA., Garrido, MV., Rodrigues, DL., Coelho, I., Lopes, D. (2021). A qualitative study about college students’ attitudes, knowledge and perceptions regarding sugar intake. Appetite. 159. https://doi.org/10.1016/j.appet.2020.105059.
Rehm CD, Peñalvo JL, Afshin A, Mozaffarian D. (2016). Dietary Intake Among US Adults, 1999-2012. JAMA. 315(23):2542–2553. doi:10.1001/jama.2016.7491
Rollins, B. (2026). Healthy and affordable food is within reach for all Americans. The Hill. Accessed via: https://thehill.com/opinion/white-house/5687877-new-dietary-guidelines-real-food/
Semuels, A. (2025). “A Battle Is Brewing Over Whole Milk.” TIME. Accessed via: https://time.com/7316536/is-whole-milk-healthy-maha/
Stewart, H., Young, S., and Byrne, AT. (2025). The percentage of U.S. adults who consumed little to no fruit grew over the 2005–March 2020 period. USDA ERS. Accessed via: https://ers.usda.gov/data-products/charts-of-note/chart-detail?chartId=110810
Tierney, M., Gallagher, A. M., Giotis, E. S., & Pentieva, K. (2017). An Online Survey on Consumer Knowledge and Understanding of Added Sugars. Nutrients, 9(1), 37. https://doi.org/10.3390/nu9010037
Thomas, P. (2026). The Beef Industry Has a Message for Consumers: Get Used to High Prices. The Wall Street Journal. Accessed via: https://www.wsj.com/business/beef-prices-higher-cattle-2e0a9b65
Todd, S. (2025). “What Kennedy’s saturated fat guidelines would mean for American health.” STAT. Accessed via: https://www.statnews.com/2025/11/12/is-saturated-fat-bad-new-dietary-guidelines-maha-vs-science/
Todd, S. (2026). “MAHA says its new food pyramid is affordable and healthy. We asked experts.” STAT. Accessed via: https://www.statnews.com/2026/01/16/affordability-new-food-pyramid-dietary-guidelines-tested-by-economists/
USDA. (2026a). Kennedy, Rollins Unveil Historic Reset of U.S. Nutrition Policy, Put Real Food Back at Center of Health. Release No.: 0003.26. Accessed via: https://www.usda.gov/about-usda/news/press-releases/2026/01/07/kennedy-rollins-unveil-historic-reset-us-nutrition-policy-put-real-food-back-center-health
USDA. (2026b). Whole Milk for Healthy Kids Act of 2025 – Implementation Requirements for the National School Lunch Program. SP 01-2026. Accessed via: https://www.fns.usda.gov/nslp/wmfhka-implementation
Wambogo E, Ansai N, Wang CY, Terry A, Fryar CD, Ahluwalia N, Ogden CL. (2022). Awareness of the MyPlate Plan: United States, 2017-March 2020. Natl Health Stat Report. (178):1-14. PMID: 36454172.
Widmar, NGO., Byrd, ES., Dominick, SR., Wolf, CA., Acharya, L. (2016). Social desirability bias in reporting of holiday season healthfulness. Preventive Medicine Reports. 4: 270-276. DOI: 10.1016/j.pmedr.2016.06.017
Appendices
Endnote 1: Background info on DGAs given to participants prior to questions
“The next set of questions will focus on the Dietary Guidelines for Americans.
The Dietary Guidelines for Americans provides advice on what to eat and drink to meet nutrient needs, promote health, and prevent disease.
The Dietary Guidelines are updated every five years and are used to:
- Form the basis of federal nutrition policy and programs such as the Supplemental Nutrition Assistance Program (SNAP) and the National School Lunch Program (NSLP)
- Support nutrition education efforts
Guide local, state, and national health promotion and disease prevention initiatives.”
Table A1. Participant Level of Agreement or Disagreement That Following Each DGA Recommendation Is Important for the Health of Their Household (N=1,028)
| Strongly Agree | Somewhat Agree | Somewhat Disagree | Strongly Disagree | |
| Eat the right amount for you. Note: The calories you need will depend on your age, sex, height, weight, and level of physical activity. |
55.6% | 38.0% | 5.1% | 1.3% |
| Prioritize protein foods at every meal. | 51.1% | 38.5% | 8.1% | 2.3% |
| Consume dairy. | 44.6% | 40.3% | 11.1% | 4.0% |
| Eat vegetables and fruits throughout the day. | 62.2% | 32.3% | 3.8% | 1.7% |
| Incorporate healthy fats. Note: Healthy fats are plentiful in many whole foods, such as meats, poultry, eggs, omega-3–rich seafood, nuts, seeds, full-fat dairy, olives, and avocados. |
53.2% | 40.6% | 4.7% | 1.6% |
| Focus on whole grains. | 47.5% | 41.2% | 8.3% | 3.0% |
| Limit highly processed foods, added sugars, and refined carbohydrates. | 57.5% | 33.4% | 6.4% | 2.7% |
| Limit alcoholic beverages. | 56.7% | 31.4% | 7.3% | 4.7% |
Table A2. Participant Level of Agreement or Disagreement That Following Each DGA Recommendation Is Realistic for Their Household (N=1,028)
| Strongly Agree | Somewhat Agree | Somewhat Disagree | Strongly Disagree | |
| Eat the right amount for you. Note: The calories you need will depend on your age, sex, height, weight, and level of physical activity. |
44.4% | 42.6% | 10.8% | 2.2% |
| Prioritize protein foods at every meal. | 40.4% | 44.6% | 12.5% | 2.4% |
| Consume dairy. | 42.5% | 41.8% | 12.4% | 3.4% |
| Eat vegetables and fruits throughout the day. | 46.2% | 36.9% | 13.2% | 3.7% |
| Incorporate healthy fats. Note: Healthy fats are plentiful in many whole foods, such as meats, poultry, eggs, omega-3–rich seafood, nuts, seeds, full-fat dairy, olives, and avocados. |
41.2% | 46.3% | 10.1% | 2.3% |
| Focus on whole grains. | 37.9% | 46.8% | 12.0% | 3.3% |
| Limit highly processed foods, added sugars, and refined carbohydrates. | 41.1% | 37.8% | 17.1% | 4.0% |
| Limit alcoholic beverages. | 54.9% | 29.3% | 10.2% | 5.6% |
Table A3. Participant Level of Agreement or Disagreement That Following Each DGA Recommendation Is Affordable for Their Household (N=1,028)
| Strongly Agree | Somewhat Agree | Somewhat Disagree | Strongly Disagree | |
| Eat the right amount for you. Note: The calories you need will depend on your age, sex, height, weight, and level of physical activity. |
42.6% | 41.0% | 11.9% | 4.6% |
| Prioritize protein foods at every meal. | 36.4% | 40.9% | 16.7% | 5.9% |
| Consume dairy. | 38.9% | 44.3% | 12.7% | 4.1% |
| Eat vegetables and fruits throughout the day. | 43.0% | 35.1% | 16.2% | 5.7% |
| Incorporate healthy fats. Note: Healthy fats are plentiful in many whole foods, such as meats, poultry, eggs, omega-3–rich seafood, nuts, seeds, full-fat dairy, olives, and avocados. |
37.1% | 42.4% | 15.8% | 4.8% |
| Focus on whole grains. | 38.8% | 43.9% | 12.3% | 5.1% |
| Limit highly processed foods, added sugars, and refined carbohydrates. | 41.6% | 37.3% | 15.0% | 6.1% |
Table A4. Frequency in Which Participants With Children 10 Years and Younger Said Their Children Follow Each Child-Specific DGA Recommendation (N=238)
| Always | Often | Sometimes | Rarely | Never | |
| No amount of added sugars is recommended. | 35.3% | 31.9% | 26.5% | 5.5% | 0.8% |
| Full-fat dairy products are important for children to help meet energy needs and support brain development. | 46.6% | 34.5% | 16.0% | 2.5% | 0.4% |
| Avoid caffeinated beverages. | 43.7% | 33.6% | 15.1% | 5.9% | 1.7% |
Table A5. Participant (Limited to Parents of Children 10 and Younger) Level of Agreement or Disagreement That Following Each DGA Recommendation Is Important for the Health of the Children in Their Household (N=238)
| Strongly Agree | Somewhat Agree | Somewhat Disagree | Strongly Disagree | |
| No amount of added sugars is recommended. | 60.9% | 33.2% | 3.8% | 2.1% |
| Full-fat dairy products are important for children to help meet energy needs and support brain development. | 57.1% | 38.7% | 3.8% | 0.4% |
| Avoid caffeinated beverages. | 65.1% | 26.1% | 8.0% | 0.8% |
Table A6. Participant (Limited to Parents of Children 10 and Younger) Level of Agreement or Disagreement That Following Each DGA Recommendation Is Realistic for Their Household (N=238)
| Strongly Agree | Somewhat Agree | Somewhat Disagree | Strongly Disagree | |
| No amount of added sugars is recommended. | 45.0% | 41.2% | 10.9% | 2.9% |
| Full-fat dairy products are important for children to help meet energy needs and support brain development. | 54.2% | 38.7% | 5.9% | 1.3% |
| Avoid caffeinated beverages. | 54.2% | 35.7% | 9.2% | 0.8% |
Table A7. Participant (Limited to Parents of Children 10 and Younger) Level of Agreement or Disagreement That Following Each DGA Recommendation Is Affordable for Their Household (N=238)
| Strongly Agree | Somewhat Agree | Somewhat Disagree | Strongly Disagree | |
| No amount of added sugars is recommended. | 50.8% | 41.6% | 6.3% | 1.3% |
| Full-fat dairy products are important for children to help meet energy needs and support brain development. | 50.4% | 39.1% | 9.7% | 0.8% |
| Avoid caffeinated beverages. | 56.3% | 33.6% | 8.0% | 2.1% |
Disclaimer: We request all readers, electronic media and others follow our citation guidelines when re-posting articles from farmdoc daily. Guidelines are available here. The farmdoc daily website falls under University of Illinois copyright and intellectual property rights. For a detailed statement, please see the University of Illinois Copyright Information and Policies here.