


Brazil Heads for a Record Soybean Harvest as Farm Margins Approach Breakeven
Brazil is projected to produce a record 6.5 billion bushels of soybeans in the 2025-26 crop season, while farm margins should decline to their lowest level in nearly two decades. Lower soybean prices, high production costs, and weak port premiums have compressed profitability for Brazilian farmers. This situation could lead to a slowdown in soybean acreage expansion in Brazil, which has been increasing year after year since the early 2000s. In this article, we analyze production costs, revenues, and profits for high-technology soybean production in Brazil. We also present the latest official projections for the harvest currently underway and discuss the implications of this changing economic environment for the global soybean market.
Rising Production Costs and Volatile Soybean Revenues
Figure 1 shows average production costs and gross revenue per acre for high-yield soybean production (over 60 bushels per acre) in Mato Grosso, Brazil’s leading soybean-producing state, from the 2009/10 to the 2025/26 crop seasons, based on estimates from the Credit Score Calculator developed by Cogo Intelligence in Agribusiness. Values are nominal and were converted from Brazilian reais to U.S. dollars using the annual average commercial exchange rate. Total production costs exclude cash rent. More than 80% of soybean farmers in Brazil operate on land they own. Instead, the land cost included in the calculation reflects the opportunity cost of land and the capital invested in it.
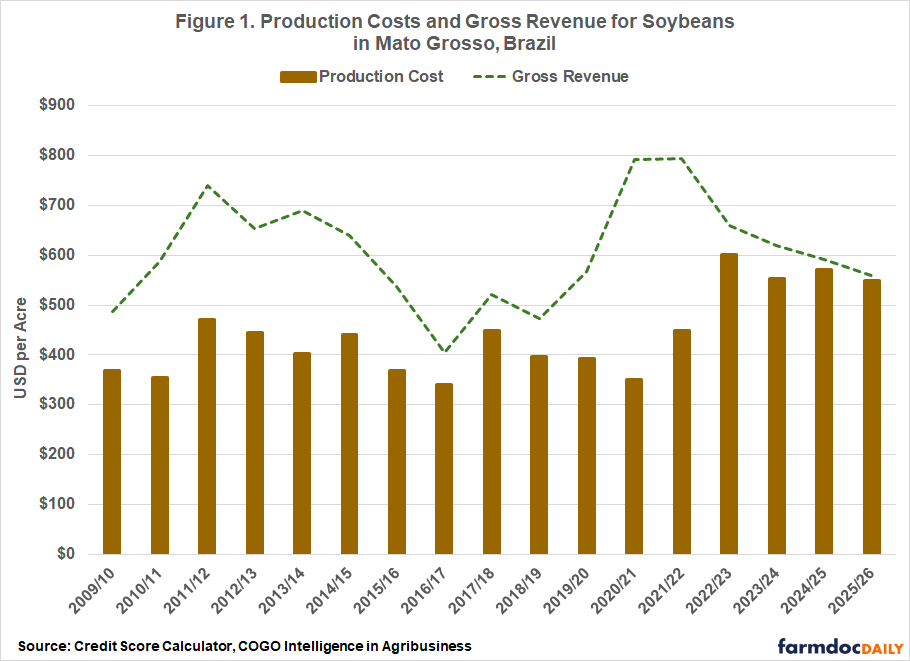
Production costs have trended upward over the long term, particularly since the 2021-22 crop season – a pattern also observed in U.S. agriculture (Langemeier et al., 2025). During the early part of the period (from 2009-10 to 2016-17), production costs generally ranged between $340 and $470 per acre in Mato Grosso, Brazil. However, beginning in 2021-22 and especially in 2022-23, costs increased sharply, reaching $602 per acre, the highest level in the series. Much of this increase was driven by higher fertilizer prices following the Russia–Ukraine conflict. Brazil imports nearly 85% of its fertilizer needs (U.S. Geological Survey, 2025), and because these inputs are priced in U.S. dollars, the appreciation of the dollar relative to the Brazilian real further amplified production costs for Brazilian farmers (Colussi and Langemeier, 2026).
Meanwhile, gross revenue has been more volatile than production costs, largely reflecting fluctuations in international soybean prices. Revenues increased during the commodity price boom in the early 2010s, peaking at $740 per acre in 2011-12. They declined during the mid-2010s price downturn, reaching a low of $405 per acre in 2016-17. A second revenue peak occurred in 2021-22 and 2022-23, when global soybean prices surged due to strong global demand and supply disruptions associated with the pandemic and the Russia–Ukraine conflict.
Farm Profitability Narrowing
Figure 2 presents economic profits per acre for high-yield soybean production (over 60 bushels per acre) in Mato Grosso, Brazil, calculated as the difference between revenues and total production costs, from the 2009/10 to the 2025/26 crop seasons, based on the Credit Score Calculator from Cogo Intelligence in Agribusiness. Values are nominal and were converted from Brazilian reais to U.S. dollars using the annual average commercial exchange rate for each year.
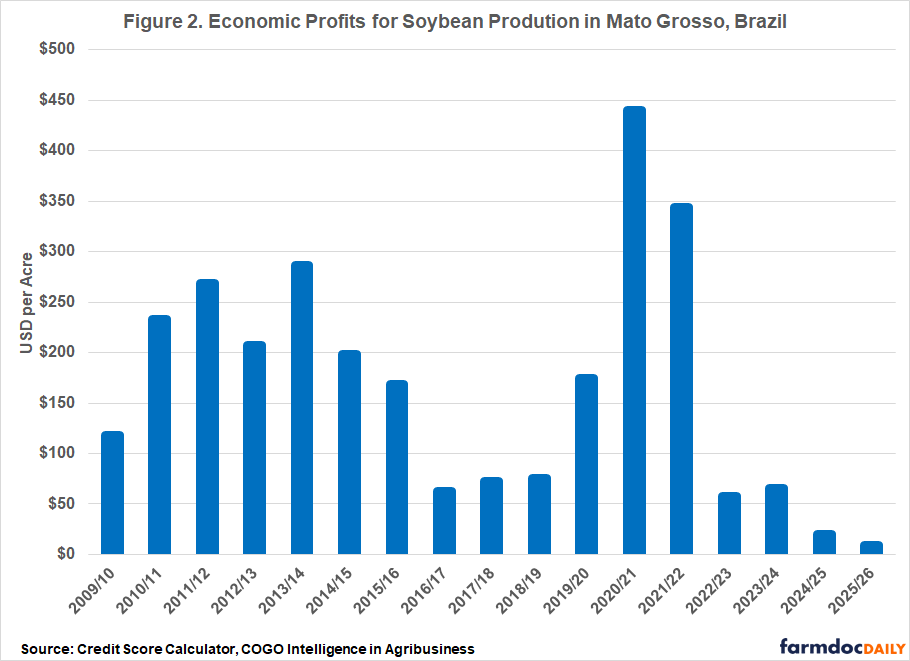
Soybean profitability fluctuated over the period analyzed. Profits increased during the early 2010s commodity price boom, reaching nearly $290 per acre in 2013-14. They then declined during the mid-2010s, falling to about $60–70 per acre between 2016-17 and 2018-19. Profitability rebounded strongly in 2020-21 as pandemic-related disruptions pushed commodity prices higher, with profits peaking at $440 per acre – the highest level in the series. In the following year, soybean prices remained elevated due to supply disruptions associated with the Russia–Ukraine war, sustaining high profitability.
Since then, profits have declined as soybean prices weakened, while production costs remained elevated. For the current crop season, expectations of another record soybean harvest, combined with lower export premiums at Brazilian ports, a less favorable exchange rate, and the China–U.S. soybean trade agreement, are expected to further reduce Brazilian producers’ returns. As a result, profits are projected to fall to $10 per acre in the 2025-26 crop season in Mato Grosso, the lowest level in nearly two decades.
Last year, trade tensions between the United States and China boosted soybean export premiums at Brazilian ports, even during a period that typically sees lower premiums due to record production. Without this temporary increase, farm margins would likely have been even tighter, potentially turning negative. On average, soybean export premiums in Brazilian ports range between +$0.40 and +$1.50 per bushel relative to futures traded on the Chicago Board of Trade, although premiums can also be negative. Premiums are determined daily in a parallel physical market linked to exchange rates and futures prices, but are primarily driven by factors affecting the supply, demand, and logistics of soybeans available for export.
In 2025, when China temporarily suspended imports of U.S. soybeans, export premiums at Brazilian ports rose to nearly $2 per bushel between August and October as Chinese buyers shifted purchases toward Brazil. This increase strengthened Brazil’s competitiveness and pushed exports to China to levels last seen in 2018 (Colussi and Langemeier, 2025), with total shipments reaching a record 4 billion bushels, nearly 80% of which were destined for China.
Rapid Soybean Expansion May Slow
Brazil’s soybean crop is projected to reach a record 6.5 billion bushels, up 4% from last year, according to the latest report from the National Supply Company (Conab) – Brazil’s official food supply and statistics agency – released on March 13, 2026 (see Figure 3). Some private consultancies project an even larger harvest, with estimates ranging from 6.6 to 6.7 billion bushels. The strong outlook reflects record planted acreage, about 120 million acres, and solid yields in the Center-West region, despite dry conditions in parts of southern Brazil. The projection indicates a record national yield of 55 bushels per acre. Harvest is currently underway, with more than 50% already completed.
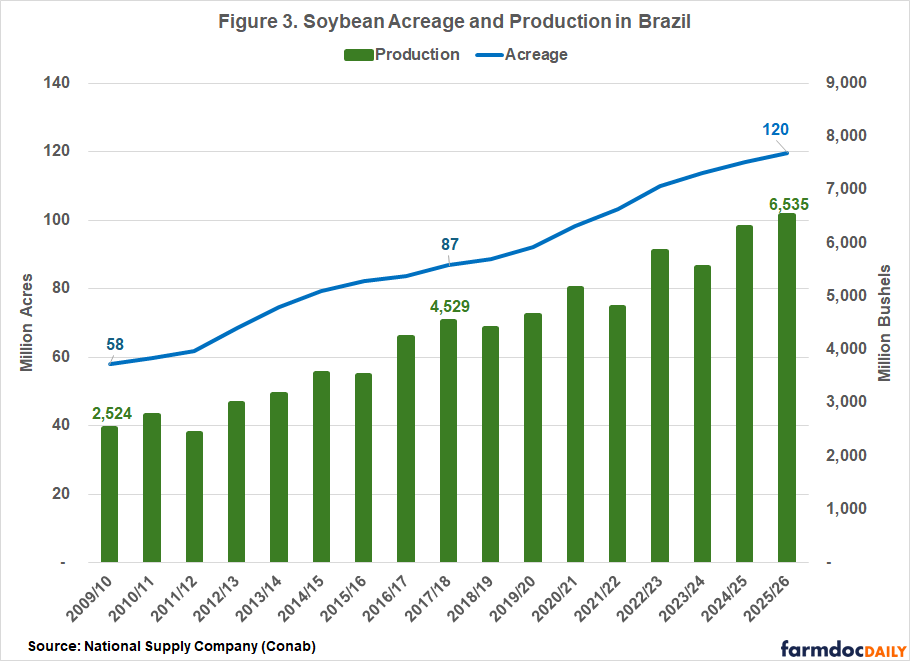
Brazil’s soybean sector has expanded rapidly over the past two decades, driven by both area expansion and productivity gains. Planted area doubled from 58 million acres in the 2009/10 crop season to 120 million acres in the current crop season, a compound annual growth rate (CAGR) of 4.6%. Over the same period, soybean production rose from 2.52 to 6.54 billion bushels, equivalent to a CAGR of 6.1%, reflecting not only the expansion in planted area but also improvements in yields.
This expansion in soybean acreage has been supported by periods of strong profitability for Brazilian farmers, growing domestic demand (livestock and biodiesel), and sustained expansion in international markets – particularly driven by China’s rising soybean imports (Colussi et al., 2025). However, given tighter farmers’ margins in recent years and limited room for further growth in the global market, mainly in China, the pace of soybean acreage expansion in Brazil is expected to slow in the next and coming crop seasons.
Final Considerations
Brazil is heading toward another record soybean harvest in 2025-26, driven by expanded acreage and favorable yields in the country’s main producing regions. However, unlike previous seasons, when record harvests were often associated with strong profitability, this year’s crop is happening in a much more challenging economic environment. Lower soybean prices, elevated production costs, and weaker export premiums have compressed margins for Brazilian farmers – pushing profitability to its lowest level in nearly two decades and close to breakeven.
Given the current situation, it is unlikely that Brazil will continue to grow at the annual rates observed over the past two decades. Historically, much of Brazil’s growth in soybean production has come from expanding planted area, particularly in the Center-West and frontier agricultural regions. However, tighter margins are likely to limit producers’ willingness and financial capacity to bring new land into production, especially in regions where production risks and investment requirements are higher.
In addition to the financial constraints faced by producers, there are indications that global soybean demand growth may begin to moderate, including in China, keeping prices relatively stable and closer to production costs. As a result, the market may not support the same pace of soybean production growth observed in recent decades. A slowdown in Brazil’s soybean expansion could reduce the pace of global supply growth, potentially easing competitive pressure in export markets and influencing price dynamics in the United States.
References
Colussi, J. & Langemeier, M. (2026). “U.S. and Brazil Soybean Competitiveness: Farm-Level Costs and Returns.” Center for Commercial Agriculture, Purdue University, February 23, 2026.
Colussi, J. & Langemeier, M. (2025). “U.S.–China Soybean Deal: Comparing Past Export Levels and Global Market Impacts.” Center for Commercial Agriculture, Purdue University, November 14, 2025.
Colussi, J., G. Schnitkey, N. Paulson and J. Coppess. "Brazil and China’s Strong Ag Relationship: Opportunity or Overdependence?" farmdoc daily (15):85, Department of Agricultural and Consumer Economics, University of Illinois at Urbana-Champaign, May 7, 2025.
Conab, National Supply Company. Crops Time Series. Soybean Production. Brasília, Brasil. March 2026.
Langemeier, M., M. Boehlje, and J. Colussi. “Financial Stress on Crop Farms: Who Is Most at Risk in the 2024–26 Downturn?” Center for Commercial Agriculture, Purdue University, September 3, 2024.
Secex, Brazilian Secretariat of Foreign Trade. Brazil’s Ministry of Development, Industry, and Trade. Exports Report. March 2026.
U.S. Geological Survey, (2025). Mineral Commodity Summaries 2025 (ver. 1.2, March 2025): U.S. Geological Survey, 212 p.
Disclaimer: We request all readers, electronic media and others follow our citation guidelines when re-posting articles from farmdoc daily. Guidelines are available here. The farmdoc daily website falls under University of Illinois copyright and intellectual property rights. For a detailed statement, please see the University of Illinois Copyright Information and Policies here.