


The Strait of Hormuz: Why Global Trade Dependency Turns a Localized Conflict into a Global Crisis
When war disrupts regions that are critical to the production or movement of major commodities, prices often spike first before markets can assess how long the supply shock will last. That was true when Russia invaded Ukraine on February 24, 2022, and it is true again with the recent military actions involving the United States and Israel against Iran. The conflict follows the earlier Twelve-Day War that took place in June of last year and has now lasted 27 days. This has pushed energy and fertilizer prices higher, and prices could rise even further if the Strait of Hormuz remains disrupted and attacks on energy infrastructure across the Gulf continue (see farmdoc daily Schnitkey et al., 2026).
Lessons from Russia’s Invasion of Ukraine
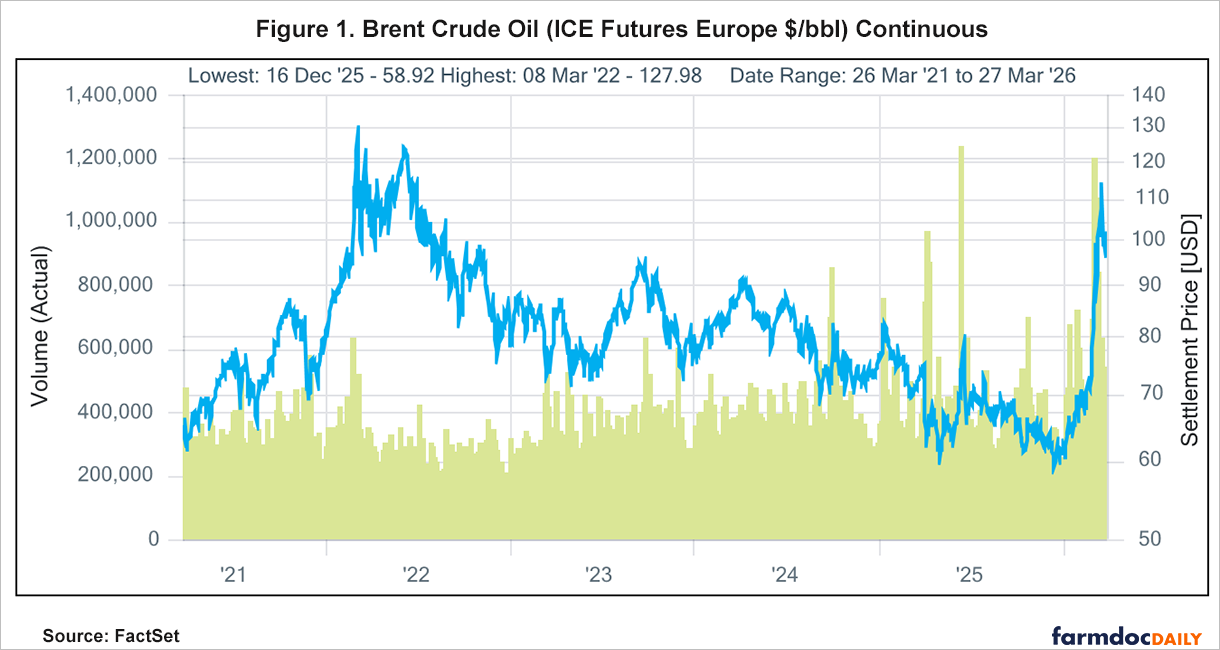
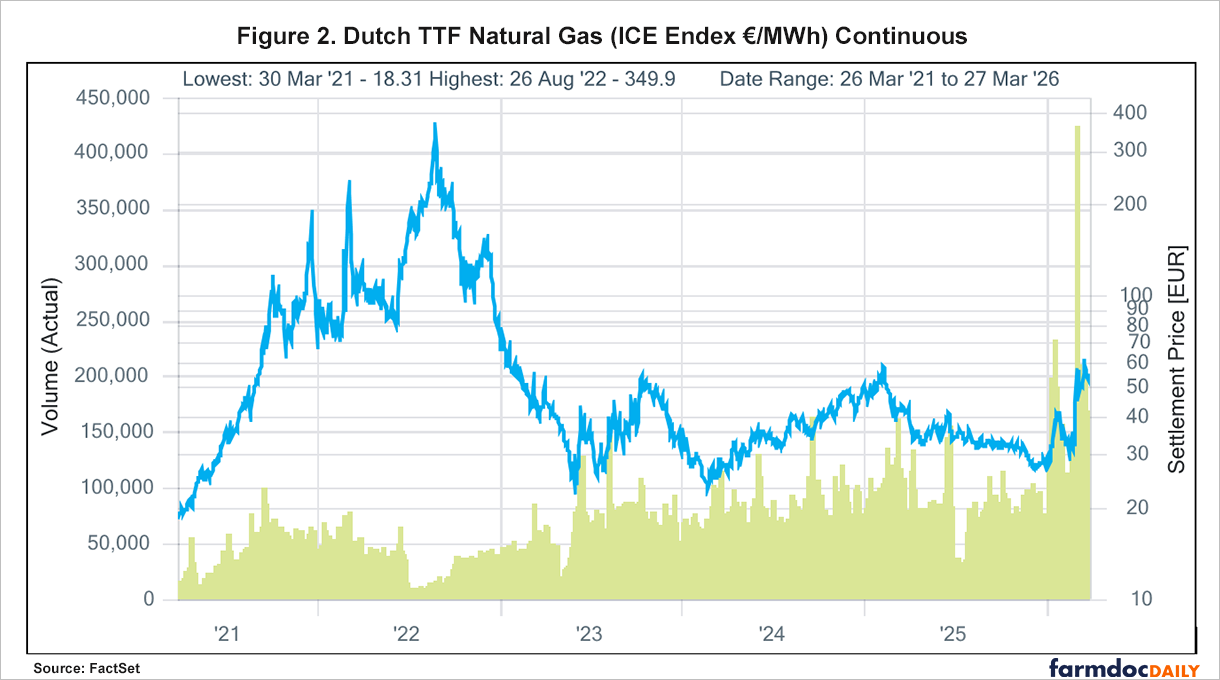
Russia’s invasion of Ukraine provides a closely related example of how markets react when war disrupts critical supply chains. In 2021, the European Union imported about 155 billion cubic meters of gas from Russia, equal to roughly 45% of its gas imports and almost 40% of its total gas consumption, with about 140 billion cubic meters transported by pipeline (see IEA, 2022). Furthermore, Russian crude oil accounted for 27% of EU crude oil imports in 2021 (see REPowerEU-3 years on). Then, energy prices began rising ahead of the February 24, 2022, invasion as Russian troop movements near Ukraine’s border heightened fears of war and possible supply chain disruptions. On the day the war broke out, the Dutch front-month, summer 2022, and winter 2022 gas contracts rose 40.65%, 65.7%, and 42.86%, respectively, while the UK March gas contract rose 58.6% (see Reuters, 2022). Over the same period, Brent crude rose above $100 per barrel for the first time since 2014 (see EIA, 2022). Those concerns deepened over the following months as Russian pipeline deliveries to Europe were cut sharply, tightening gas supplies, and forcing buyers to compete for replacement cargoes. They intensified again in late September 2022, when leaks and explosions damaged the Nord Stream 1 and 2 pipelines, reinforcing the view that Europe could no longer rely on Russian gas infrastructure even if battlefield conditions stabilized (see AP, 2022).
Europe eventually found ways to reduce its dependence on Russian energy, but adjusting supply chains can be a slow and costly process. Between August 2022 and January 2025, the EU reduced gas demand by 17%, or roughly 70 billion cubic meters per year, while Russia’s share of EU gas imports fell from 45% in 2021 to 19% in 2024, and was projected to have fallen to 13% by 2025 (see REPowerEU-3 years on). Europe’s shift was also evident in oil markets. Since 2021, the share of EU (refined) petroleum oil imports coming from Russia had declined from 29% to 1% by the fourth quarter of 2025, while crude oil imports had fallen from 27% to 3% (see Eurostat, 2026; REPowerEU-3 years on). Additionally, this shift depended not only on finding alternative suppliers, but also on large investments in LNG import capacity, cross-border interconnectors, storage, and the accelerated deployment of renewables and energy-efficiency measures. The broader lesson is that conflict can impose real adjustment costs, and prices can remain elevated until buyers are able to restructure supply chains around alternative sources.
Why the Strait of Hormuz Matters
The disruptions to the Strait of Hormuz, together with damage to regional energy infrastructure, increase the risk of an escalation trap, in which limited strikes trigger wider economic and supply chain shocks, and those higher costs in turn pressure leaders to expand military operations rather than scale them back (see Time, 2026). It remains unclear when this conflict will end or what the cost will be. For energy and fertilizer markets, the central issue is how global trade, particularly flows bound for Asia, depends on this narrow waterway, while short-run alternatives remain limited.
A substantial share of global trade in fertilizer, oil, and natural gas depends on the Strait of Hormuz. Roughly one-third of global seaborne fertilizer trade moves through the Strait (see UNCTAD, 2026). Additionally, about 25% of global seaborne oil trade pass through the waterway, translating to an average of 20 million barrels per day of crude oil and oil products in 2025; 80% were destined for Asia (see IEA, 2026). The Strait is also important for Qatar’s and the United Arab Emirates’ LNG exports, carrying 93 percent and 96 percent of their LNG exports, respectively, and together accounting for roughly 19% of global LNG trade (see IEA, 2026). Roughly 83% of LNG exports that passed through the Strait of Hormuz in 2024 went to Asia (see UNCTAD, 2026). Against that backdrop, the disruption to the Strait has substantially slowed vessel traffic compared to pre-war levels, with the average daily ship transits declining from 129 transits between February 1-27, 2026 to only 4 transits being made on March 7, 2026 (see UNCTAD, 2026).
The Strait of Hormuz matters not only because of the volume of oil, gas, and fertilizer that passes through it, but also because alternatives are limited. Energy facilities across the Gulf have already been damaged, and the process of repairing infrastructure and restoring normal shipping flows could take weeks, months, or, in some cases, years. As a result, markets are watching for credible signs of de-escalation and evidence that shipping through the Strait can safely resume.
Conclusion
The ongoing conflict in the Middle East is a stark reminder that, in a highly integrated global economy, localized conflicts are rarely contained. Their effects are not evenly distributed. Asia is especially vulnerable because it is the main destination for oil and LNG shipments transiting the Strait of Hormuz, while many economies in Africa are particularly exposed to higher energy, fertilizer, transport, and food costs. Because roughly one-third of global seaborne fertilizer trade and substantial shares of oil and LNG shipments move through the Strait, disruptions there can quickly tighten global supply. With few alternative routes available and damage to Gulf energy infrastructure further limiting exports, prices are likely to remain elevated and markets volatile until there is a credible path to de-escalation and clear progress in restoring shipping and production capacity.
References
AP. 2022. “Nord Stream pipeline leaks fuel concerns of sabotage.” Associated Press, September 27, 2022. https://apnews.com/article/russia-ukraine-germany-berlin-00232df3f4b4bc89afd47d4707724e33
EIA. 2022. “Crude oil prices rise above $100 per barrel after Russia’s further invasion into Ukraine” U.S. Energy Information Administration, Today in Energy, March 4, 2022. https://www.eia.gov/todayinenergy/detail.php?id=51498
Eurostat. 2026. “EU trade with Russia – latest developments.” Statistics Explained. https://ec.europa.eu/eurostat/statistics-explained/index.php?title=EU_trade_with_Russia_-_latest_developments
IEA. 2022. “A 10‑Point Plan to Reduce the European Union’s Reliance on Russian Natural Gas.” International Energy Agency. https://www.iea.org/reports/a-10-point-plan-to-reduce-the-european-unions-reliance-on-russian-natural-gas
IEA. 2026. “Oil Security and emergency response: Strait of Hormuz Factsheet.” International Energy Agency. https://www.iea.org/about/oil-security-and-emergency-response/strait-of-hormuz
REPowerEU. 2025. “REPowerEU – 3 years on.” European Commission. https://energy.ec.europa.eu/topics/markets-and-consumers/actions-and-measures-energy-prices/repowereu-3-years_en
Reuters. 2022. “Prices spike on Russian invasion of Ukraine.” February 24, 2022. https://www.reuters.com/business/energy/prices-spike-russian-invasion-ukraine-2022-02-24/
Schnitkey, G., C. Zulauf, N. Paulson and J. Baltz. “The Iran Conflict: Potential Impacts on 2026 Corn and Soybean Returns.” farmdoc daily (16):45, Department of Agricultural and Consumer Economics, University of Illinois at Urbana-Champaign, March 17, 2026.
Time. 2026. “Trump Cannot Achieve Iran Goals With Bombing Alone, Expert on Airpower Warns.” TIME Magazine, March 3, 2026. https://time.com/7382278/iran-bombing-regime-change-pape/
UNCTAD. 2026. “Strait of Hormuz Disruptions: Implications for Global Trade and Development.” United Nations Conference on Trade and Development. https://unctad.org/system/files/official-document/osgttinf2026d1_en.pdf
Disclaimer: We request all readers, electronic media and others follow our citation guidelines when re-posting articles from farmdoc daily. Guidelines are available here. The farmdoc daily website falls under University of Illinois copyright and intellectual property rights. For a detailed statement, please see the University of Illinois Copyright Information and Policies here.