


Strait of Hormuz Closure and Fertilizer Supply Risks for U.S. Agriculture
Following the start of “Operation Epic Fury” on February 28, 2026, risks to shipping through the Strait of Hormuz increased sharply. By early March, the Strait’s effective closure was already disrupting global oil and fertilizer supply chains and contributing to broader market uncertainty. This article examines the commodity market response in the first two weeks of the disruption and evaluates the vulnerability of the U.S. fertilizer supply to a prolonged closure.
Initial Commodity Market Response
Figure 1 highlights a clear divergence in commodity market responses to the Hormuz disruption, with energy markets experiencing the largest price increases and agricultural futures rising more modestly (see farmdoc daily article from March 17, 2026). Oil and gas futures increased sharply relative to pre-attack levels, as heating oil, crude oil, gasoline, and Brent crude rose by 5.8% to 50.4%. This strong response underscores the Strait of Hormuz’s importance as a global energy chokepoint and reflects market concerns over potential supply disruptions. Crop futures also increased, though by a smaller margin, with gains ranging from 3.6% to 8%. Soybean futures rose during the first two weeks but are down 0.1% from before the war started. Overall, the figure suggests that the disruption generated broad effects across commodity markets, but the most immediate and pronounced impacts were concentrated in energy markets.
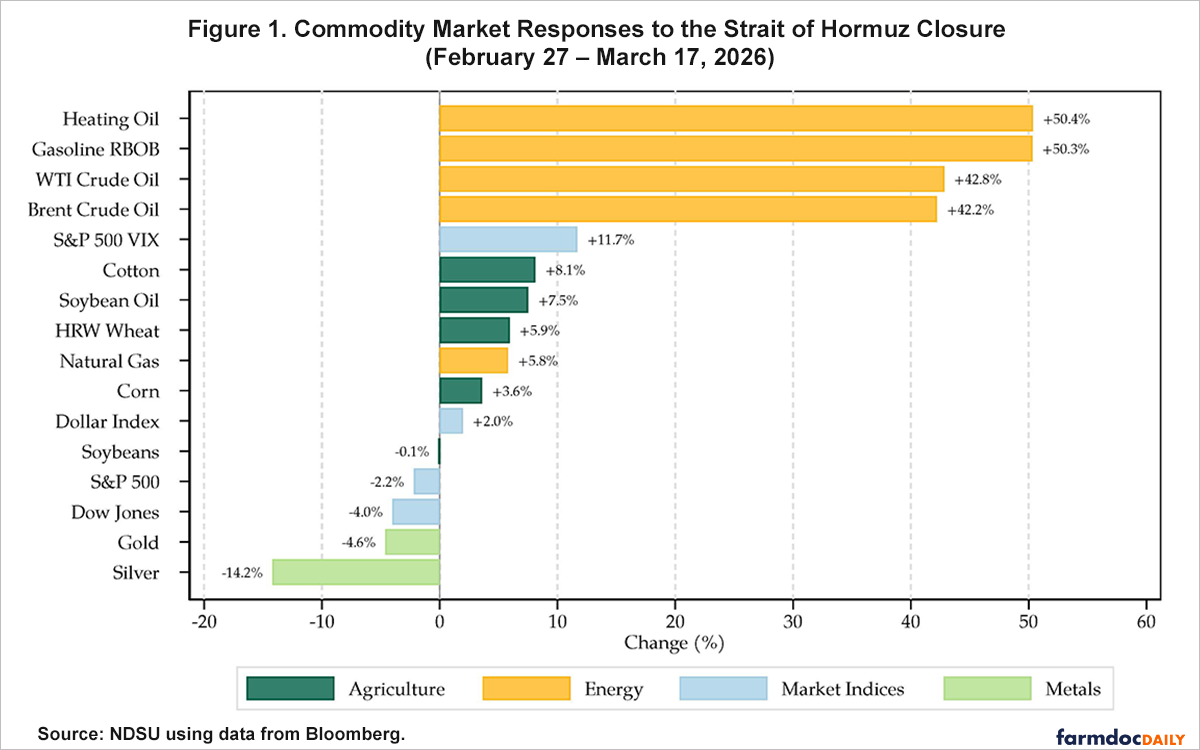
Broad market indices also pointed to heightened investor anxiety following the Hormuz disruption. Between the pre-attack date and March 17, 2026, the S&P 500, the leading benchmark for large-cap U.S. equities, fell 2.2%, while the Dow, which tracks 30 major publicly traded U.S. companies, declined 4.0%. At the same time, the VIX, a widely used measure of expected volatility in the S&P 500, rose by 11.7%. Together, these movements suggest that the disruption affected not only commodity markets but also broader financial sentiment.
Figure 2 places the current run-up in fertilizer prices into historical context. Over the past decade, U.S. Gulf Coast fertilizer markets have moved through three major price episodes. The first and largest followed Russia’s invasion of Ukraine, which triggered a broad fertilizer shock that pushed DAP, MAP, and urea above $1,000 per metric ton ($/MT), potash above $880/MT, and UAN above $680/MT at their peaks. Those increases were striking relative to pre-2020 norms, when DAP, MAP, urea, and potash generally traded in the $250 to $350/MT range and UAN averaged just over $180/MT. Although prices retreated from those highs, they did not return to earlier baseline levels. A second, smaller upswing emerged in 2025, when DAP and MAP climbed above $800/MT, urea rose above $500/MT, potash exceeded $370/MT, and UAN moved above $390/MT.
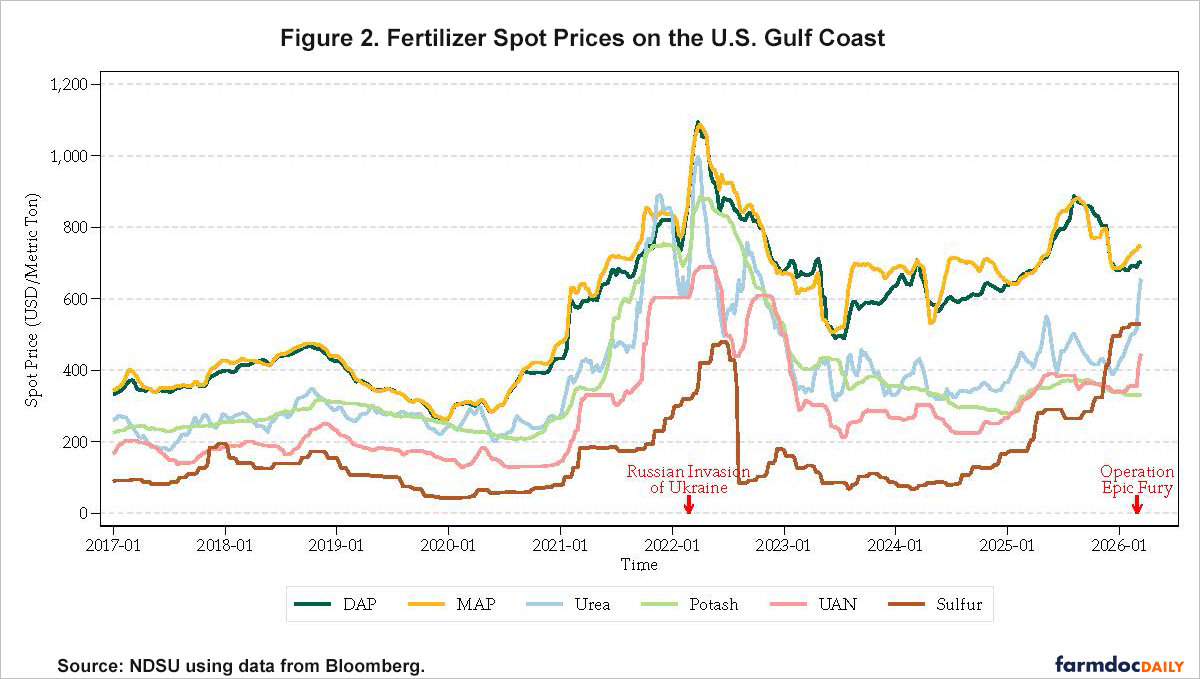
The latest increase began after “Operation Epic Fury”, renewing concerns about supply disruptions. As of March 17, 2026, DAP and MAP have risen above $700/MT, urea has moved above $600/MT, and UAN has surpassed $400/MT. Potash has been the exception. Unlike the sharper increases seen in other fertilizers, potash prices were largely unchanged during the first two weeks after the attack and have only recently edged up to slightly above $330/MT.
Comparison of the 2022 Russia-Ukraine War Shock and the 2026 Hormuz Strait Closure
Table 1 shows that the 2022 Russian invasion of Ukraine triggered a much stronger price response in grain markets than the 2026 Strait of Hormuz closure. The 2022 shock had especially large effects on wheat and other major grain crops because Russia and Ukraine together account for approximately 29% of global wheat exports. Hard Red Winter Wheat prices rose by more than 70% relative to pre-invasion levels, underscoring the direct exposure of global grain supply chains to the conflict. By contrast, the 2026 Hormuz closure has generated more modest price increases across grain markets, with corn, wheat, soybeans, and soybean oil rising by 2% to 7.5%, reflecting the Persian Gulf region’s more limited role in global grain exports. Soybean futures rose during the first two weeks after the Hormuz closure, only to fall back to about 0.1% below the pre-crisis level.
Table 1. Price Effects of 2022 Russia-Ukraine War vs 2026 Hormuz Strait Closure Shock |
||||||
| 2022 Russian Invasion of Ukraine | 2026 Hormuz Strait Closure | |||||
| January 2022 | 2022 Peak | % Change | Pre-Closure
(Feb 27, 2026) |
Post-Closure
(March 17, 2026) |
% Change | |
| Crop Prices ($/MT) | ||||||
| Wheat (HRW) | 289.3 | 502.6 | 73.8% | 210.5 | 222.9 | 5.9% |
| Corn | 239.7 | 322.1 | 34.4% | 172.7 | 178.9 | 3.6% |
| Soybean | 513.7 | 650.0 | 26.5% | 425.2 | 424.9 | -0.1% |
| Soybean Oil | 1333.5 | 1997.4 | 49.8% | 1351.2 | 1452.6 | 7.5% |
| Fertilizer Prices ($/MT) | ||||||
| Urea | 712.6 | 1003.1 | 40.8% | 518.1 | 664.1 | 28.2% |
| DAP | 786.3 | 1096.8 | 39.5% | 686.2 | 703.8 | 2.6% |
| MAP | 814.4 | 1088.5 | 33.7% | 735.8 | 746.8 | 1.5% |
| Potash | 741.0 | 884.6 | 19.4% | 330.7 | 333.5 | 0.8% |
Source: NDSU using data from Bloomberg.
Fertilizer prices responded differently across the two disruptions, both in magnitude and timing. Following the 2022 Russian invasion of Ukraine, prices for major fertilizers increased by roughly 20% to 40%, with peak levels reached only after two to four months. Urea rose by more than 40%, DAP and MAP by more than 30%, and potash by more than 19% within the first month or two after the invasion. In contrast, the 2026 Hormuz closure has produced a much faster response in nitrogen markets, with urea prices already up more than 28% within three weeks, likely reflecting the concentration of urea and ammonia production in the Persian Gulf. So far, however, price responses in other fertilizers have been more muted. Potash prices have remained unchanged for the first two weeks and are now only 0.8% higher, while DAP and MAP have increased by less than 3%. These patterns suggest that the current disruption has had its strongest immediate effects on nitrogen fertilizers, while the full effects on other products may still be unfolding.
U.S. Fertilizer Supply Exposure to the 2026 Hormuz Closure
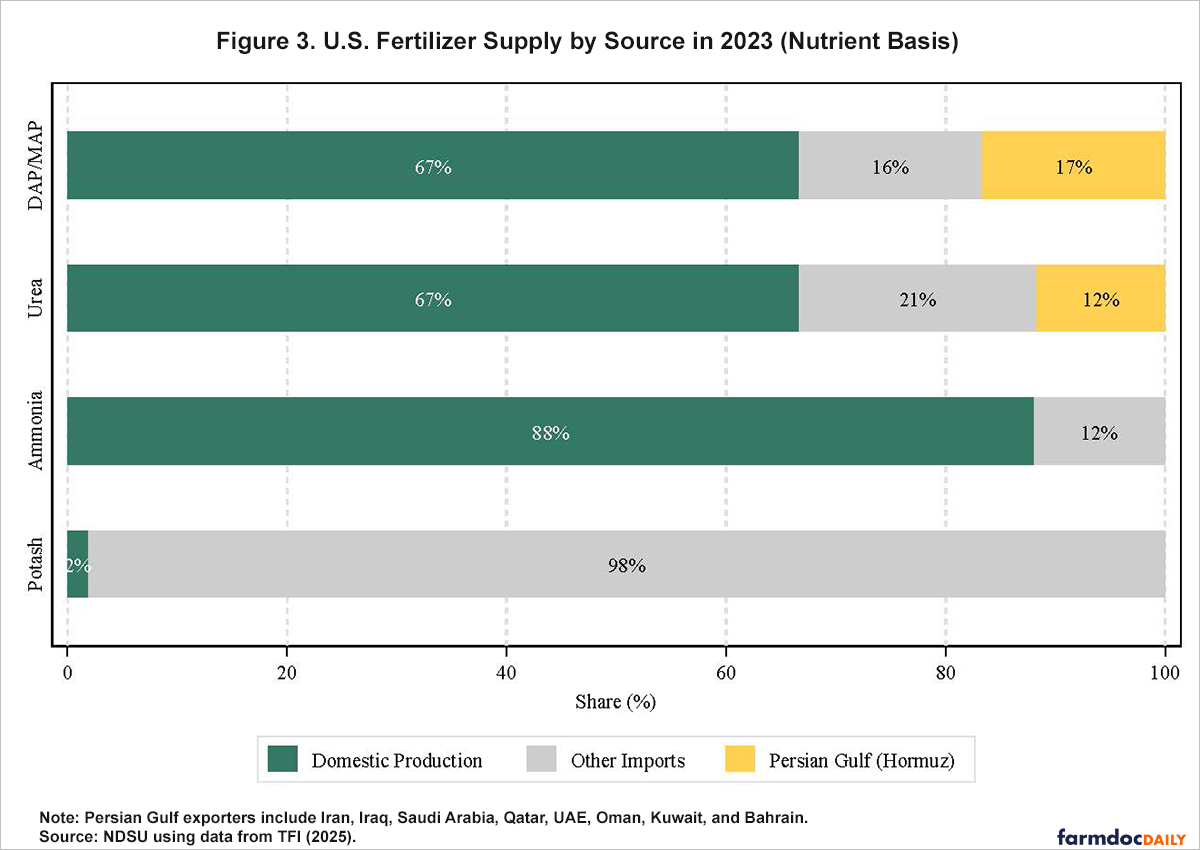
Figure 3 shows how the U.S. fertilizer supply was divided in 2023 among domestic production, non-Gulf imports, and Persian Gulf imports that depend on transit through the Strait of Hormuz. The shares make clear that direct exposure is minimal for ammonia and potash, largely because the United States relies on strong domestic ammonia production and does not depend on the Strait of Hormuz for potash imports. The picture is more concerning for urea and phosphate fertilizers. A meaningful share of DAP and MAP supply comes from the Gulf, primarily from Saudi Arabia, while urea markets also remain exposed to Gulf-origin supply. That dependence has become more concentrated in recent years. Countervailing duties have largely excluded Moroccan and Russian phosphate from the U.S. market since 2021, while China’s phosphate export suspension has further increased reliance on Saudi supply (Arita et al., 2026).
Compared with other major agricultural economies, the United States shows moderate dependence on Gulf fertilizer supply. Table 2 compares the vulnerability of major agricultural producers across key products, including urea, DAP/MAP, potash, and anhydrous ammonia, using the share of total domestic consumption sourced from the Persian Gulf. In 2023, 17% of U.S. urea consumption and 20% of DAP/MAP consumption came from the Gulf, while exposure in potash and anhydrous ammonia was negligible. Across countries, Australia appears most vulnerable in urea, with 72% of consumption sourced from the Gulf, while India is by far the most exposed in ammonia, with 81% tied to Gulf supply. Dependence in DAP/MAP is more evenly distributed, although Australia and the United States show the highest shares. Potash shows little to no direct Gulf exposure across the major agricultural economies considered here. Overall, Brazil and India appear most dependent on Gulf fertilizer supply, both in relative and absolute terms.
Table 2. Share of National Fertilizer Consumption Transiting Through the Strait of Hormuz |
|||||
| Product | United States | Brazil | India | Australia | EU-27 |
| DAP/MAP | 19.6% | 15.0% | 16.9% | 22.5% | 0.0% |
| Urea | 17.1% | 44.8% | 9.0% | 72.3% | 2.3% |
| Ammonia | 0.3% | 0.0% | 80.6% | 0.0% | 5.1% |
| Potash | 0.0% | 0.0% | 0.3% | 0.1% | 0.0% |
| Total Volume | 2.7 MMT | 4.4 MMT | 7.3 MMT | 2.6 MMT | 0.3 MMT |
Note: Vulnerability is calculated as imports from the Middle East divided by domestic consumption (production+total imports−total exports), based on physical product tons. Total volume reflects total import volume from the Middle East for urea, DAP/MAP, potash, and anhydrous ammonia in 2023.
Source: NDSU using 2023 data from FAOSTAT (2022 data for U.S. production), IFA (2024), and the S&P Global Trade Atlas.
Outlook
The early market response to the Hormuz disruption points to a concentrated rather than broad-based risk for U.S. agriculture. Energy markets reacted most sharply, but in fertilizer markets the strongest response has so far been concentrated in nitrogen products, especially urea, where prices rose by more than 28% within three weeks. That pattern differs from the broader fertilizer shock that followed the 2022 Russian invasion of Ukraine, but historical experience suggests the current effects may still be in an early phase. Fertilizer prices often continue to rise for several months after the initial disruption, particularly when supply chains remain constrained, prompting buyers to adjust procurement strategies.
For the United States, the main concern is less overall dependence on Gulf fertilizer supplies than the timing and composition of that exposure. U.S. markets are relatively insulated in potash and ammonia, but reliance on Gulf-sourced urea and phosphate still leaves them vulnerable at a critical point in the crop calendar. With the disruption unfolding just ahead of the spring planting season, a prolonged closure would likely be felt through higher input costs, tighter availability in selected fertilizers, and additional pressure on farm margins in 2026, with the effects likely to be most severe in regions at the end of supply chains. The mid-run outlook will depend heavily on the duration of the disruption. A short interruption would likely produce a temporary price spike, while a more prolonged closure could lead to broader fertilizer market tightening as trade flows adjust and inventories are drawn down.
References
Arita, S., Chakravorty, R., Kim, J., Lwin, W., and Steinbach, S. (2026). Strait of Hormuz Closure and Global Fertilizer Trade Disruptions. NDSU Agricultural Trade Monitor 2026‐03. Center for Agricultural Policy and Trade Studies, North Dakota State University. March 12, 2026. https://doi.org/10.22004/ag.econ.396250.
FAO. (2025). FAOSTAT: Fertilizers by Product. https://www.fao.org/faostat/en/#data/RFB, accessed March 10, 2026.
International Fertilizer Association (IFA). (2024). IFASTAT: World Production Statistics by Country. https://www.ifastat.org/databases/graph/2_1
Schnitkey, G., C. Zulauf, N. Paulson and J. Baltz. "The Iran Conflict: Potential Impacts on 2026 Corn and Soybean Returns." farmdoc daily (16):45, Department of Agricultural and Consumer Economics, University of Illinois at Urbana-Champaign, March 17, 2026.
The Fertilizer Institute (TFI). (2025). Mid-Year 2025 Fertilizer Market Update. https://www.tfi.org/wp-content/uploads/2025/07/Mid-Year-2025-Fertilizer-Market-Update.pdf
Disclaimer: We request all readers, electronic media and others follow our citation guidelines when re-posting articles from farmdoc daily. Guidelines are available here. The farmdoc daily website falls under University of Illinois copyright and intellectual property rights. For a detailed statement, please see the University of Illinois Copyright Information and Policies here.