


Forecast Performance of RMA Expected Yields
The January 27, 2026 farmdoc daily raised questions about the performance of the Risk Management Agency (RMA) expected yields for Illinois corn and soybean county yields. Extending that analysis, this study finds that, over 2015-2024, RMA expected, or projected, county yields understated US corn, soybean, and wheat actual county yields. However, RMA methods overstated cotton yields. This difference between average projected and actual yields contributed to corn and soybeans having lower payments for simulated 95% Enhanced Coverage Option with Revenue Protection (ECO 95% RP) insurance. RMA procedures overstated ECO payments for cotton.
Accuracy of RMA Projected Yields
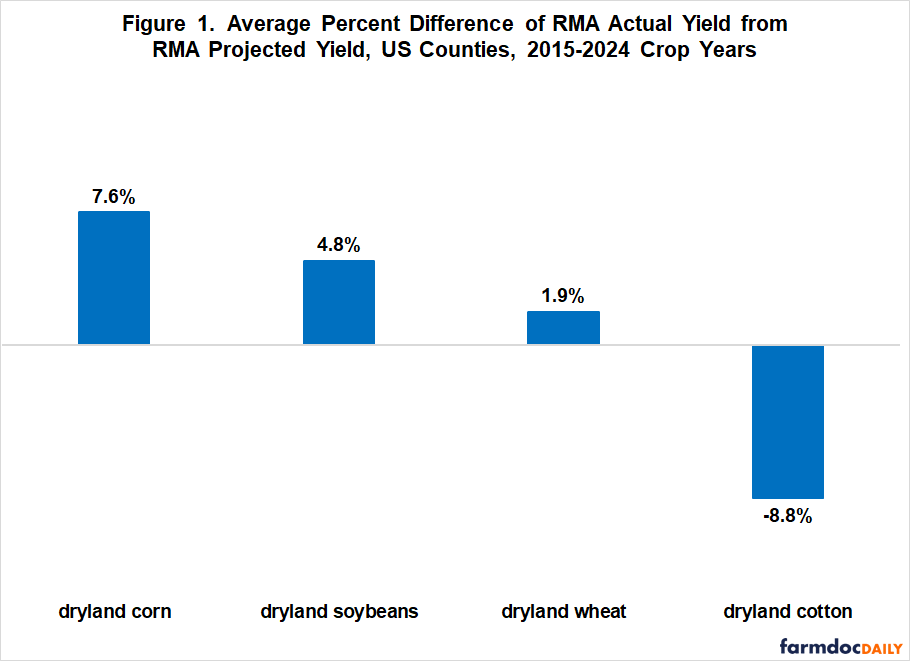
Actual county dryland yields reported by RMA exceeded their projected or expected dryland county yields on average by 7.6% for corn, 4.8% for soybeans, and 1.9% for wheat across, respectively, 1,907, 1,549, and 1,487 US counties (see Figure 1). In contrast, actual dryland yields averaged 8.8% less than projected dryland yields for 463 upland cotton counties. To create a consistent data set of counties with a long-term history of producing a crop, this study includes only counties with RMA actual yields for all years from 1991, first year in the RMA county yield dataset. Projection performance is assessed for the 2015-2024 crop years. These years postdate the county yields used to rate the initial offering of Supplemental Coverage Option (SCO) insurance for 2015 crops.
Average ECO 95% RP Payment
Actual yields averaging above expected yields implies crop insurance products have a lower probability of making payments and make smaller payments, all other factors the same. Conversely, actual yields averaging above expected yields implies more, larger payments, all other factors the same. As a simple investigation of these hypotheses, payments by ECO 95% RP insurance were calculated using RMA county yields for 2015-2024. Payments, expressed as a percent of projected insurance revenue, were consistent with the hypotheses: lowest for soybeans (2.1%) and corn (2.3%), highest for upland cotton (5.0%), with wheat in between (3.2%) (see Figure 2). Data and calculation procedures are discussed in Data Note 1.
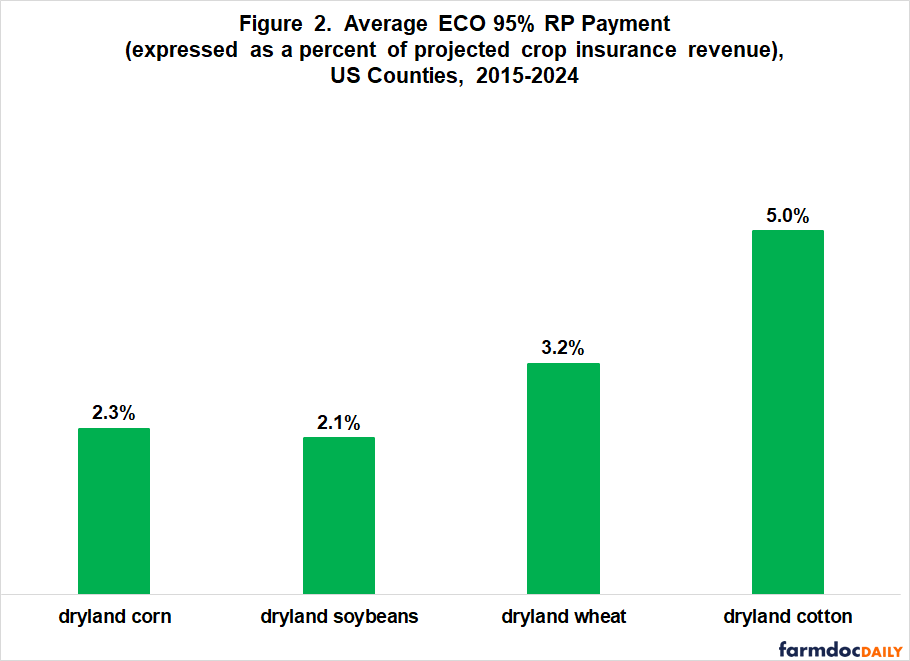
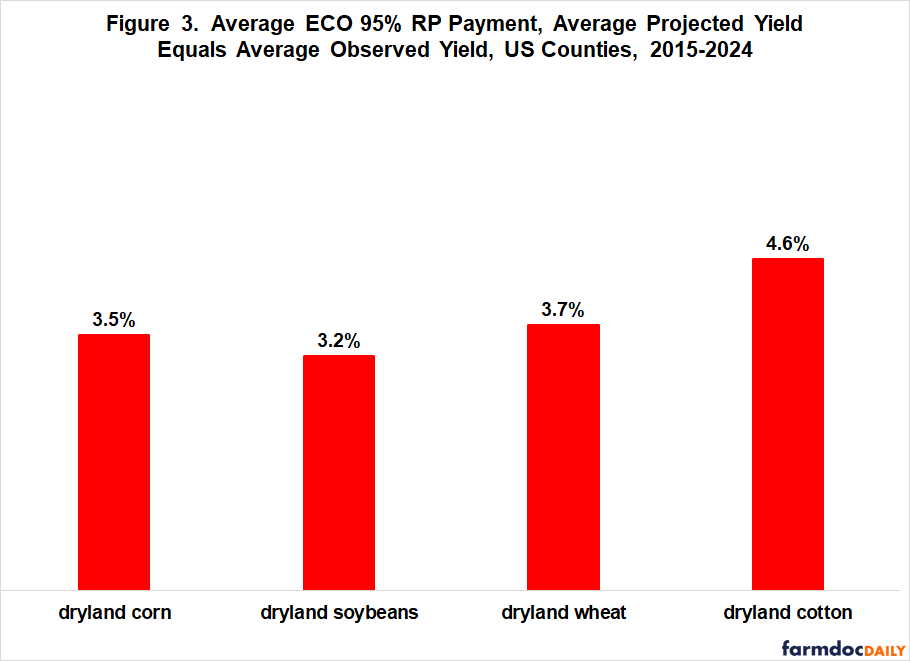
Projection inaccuracy is one of many factors that can result in different payment rates. A simple procedure is used to provide perspective on its potential role. ECO 95% RP payments were calculated assuming a county’s projected yield for each year is the average county actual yield for the 2015-2024 crops (see Data Note 2 for an example). Average projected yield thus equals average actual yield for each county-crop combination. Again, the idea is not to propose this method, which depends on future yields, but illustrate the impact of different methods on insurance payments. Across the four crops, the range in average ECO 95% RP payments using this procedure is half the range using RMA projected yields. For RMA projected yields, the range is 2.9 percentage points (Figure 2, 5.0% for upland cotton minus 2.1% for soybeans). Assuming average forecast and actual yields are the same, the range is 1.4 percentage points (Figure 3, 4.6% for upland cotton minus 3.2% for soybeans). Payment rates increase for corn, soybeans, and wheat but decline for upland cotton.
Discussion
This analysis underscores the importance of RMA yield projection procedures in determining payments by crop insurance.
Congressional and Administrative decisions to subsidize SCO and ECO at 80% further underscores this importance going forward.
Because crop insurance payments are tied to planted acres, they can influence acreage decisions (see farmdoc daily March 11, 2026). By extension, if payment calculation procedures favor a crop(s), even for short periods of time, program design can influence acreage decisions.
RMA procedures need to be reexamined. Crop insurance, especially ECO and SCO due to their 80% subsidy and high coverage levels, are payment programs with a risk management role rather than a risk management program with a payment role. A change in objectives requires a reevaluation of procedures to make sure crops are planted for the market, not for government policy, with all the attendant consequences for higher government costs.
Data Note 1: ECO 95% covers area (usually county) losses between 5% and 14%. RP losses are calculated: [(RMA actual (i.e. harvest) yield times RMA harvest price) divided by (RMA projected yield times the higher of RMA projected or RMA harvest insurance price)] minus 100%. ECO payment covers county losses between 5% and 14%. Insurance prices are from RMA’s price discovery database. Prices are by state. States included in the analysis for wheat had RMA insurance prices for only one type of wheat. Texas is the only state with multiple corn and soybean pricing / sale closing dates. Its multiple prices were averaged. Estimated per acre payment by ECO 95% RP for a county and crop was weighted by its share of insured 2025 crop year acres summed across all counties in this analysis for a given crop.
Data Note 2: To illustrate the assumption used to create Figure 3, RMA actual yields for Champaign, county Illinois corn for 2015-2024 are sequentially 188, 224, 214, 236, 192, 204, 228, 224, 223, and 240. The 221 average yield is the projected yield for each of the 10 years from 2015 through 2024.
References
Schnitkey, G., H. Monaco, N. Paulson, C. Zulauf and B. Sherrick. "Expected Yields for SCO and ECO in Illinois." farmdoc daily (16):12, Department of Agricultural and Consumer Economics, University of Illinois at Urbana-Champaign, January 27, 2026.
US Department of Agriculture, Risk Management Agency. March 2026. Price Discovery Reporting. http://www.rma.usda.gov
US Department of Agriculture, Risk Management Agency. March 2026. Summary of Business. http://www.rma.usda.gov
Zulauf, C., H. Monaco, G. Schnitkey, N. Paulson and J. Coppess. "Insurance Impacts in the Presence of High Subsidy – High Coverage Products: A Case Study of STAX." farmdoc daily (16):41, Department of Agricultural and Consumer Economics, University of Illinois at Urbana-Champaign, March 11, 2026.
Disclaimer: We request all readers, electronic media and others follow our citation guidelines when re-posting articles from farmdoc daily. Guidelines are available here. The farmdoc daily website falls under University of Illinois copyright and intellectual property rights. For a detailed statement, please see the University of Illinois Copyright Information and Policies here.