


High Fertilizer Prices Suggest Reconsidering Application Rates
The ongoing conflict with Iran has resulted in significantly higher nitrogen fertilizer prices as damaged energy infrastructure and closure of the Strait of Hormuz has created supply chain bottlenecks (see farmdoc daily articles from March 17, March 23, March 24, and March 27, 2026). Nitrogen fertilizer prices have been slowly increasing since the fall, but those increases have escalated sharply since the conflict began. Price increases since late February have ranged from 20-25% for anhydrous ammonia to more than 40% for urea at locations in the Corn Belt region of the US (see slides and video from farmdoc webinar on March 26, 2026) .
Corn prices have increased as well but not as much as fertilizer prices. As a result, recommended nitrogen application rates are lower under current pricing conditions compared with last fall. For farmers who apply a portion of their nitrogen in the spring, reducing remaining nitrogen applications to be more in line with the Maximum Return to Nitrogen (MRTN) rate recommendations would be highly advised to avoid unnecessary costs and maximize returns. This is particularly true for situations where spring nitrogen needs were not priced prior to the price increases experienced since the start of the conflict in Iran.
What is the MRTN?
The MRTN calculator was developed and continues to be maintained by University soil fertility specialists from states in the Corn Belt region of the US. The calculator uses results from research trials and provides rate recommendations which maximize the economic return to nitrogen. The recommendations are specific to location or region, crop rotation, and the prices for both corn and nitrogen. Users can use the calculator to provide a recommendation based on a single set of prices or use the multiple price mode to look at different scenarios for corn and nitrogen prices to compare recommendations.
For Illinois, N rate recommendations are provided for three regions (northern, central, and southern) for corn following soybeans and for two regions (northern and central) for corn following corn. The rate recommendations will also vary based on the prices provided by the user for corn and nitrogen.
Four common nitrogen fertilizer products can be selected with prices for those products entered as quoted and then converted to $/lb of N by the calculator. Users can also enter prices in $/lb of N directly.
Based on these inputs, the calculator provides a recommended rate – the MRTN – that maximizes the farmer’s return to nitrogen. It is also important to note that the MRTN recommendation accounts for all potential sources of applied nitrogen. Producers should consider the nitrogen contributions from other sources such as manure, DAP, and MAP. Higher nitrogen prices will result in lower MRTN rates holding the corn price constant. Higher corn prices will result in higher MRTN rates holding the fertilizer price constant.
MRTN for Central Illinois in 2026
Average prices as reported in the bi-weekly Illinois Production Cost Report from USDA’s Ag Marketing Service (USDA-AMS) have increased sharply since the start of the conflict in Iran on February 27th. Figure 1 shows average prices in Illinois for anhydrous ammonia, urea, and liquid N solutions (both 28% and 32%) on a $ per lb of N basis from the start of 2025 through the latest report released on March 20th. From February 20th to March 20th, anhydrous prices increased from $0.51 to $0.61 per lb of N (+18%). Prices for 28% and 32% liquid N and urea have all increased to around $0.89 per lb of N, with urea experiencing the largest percentage increase of 42% since February 20th.
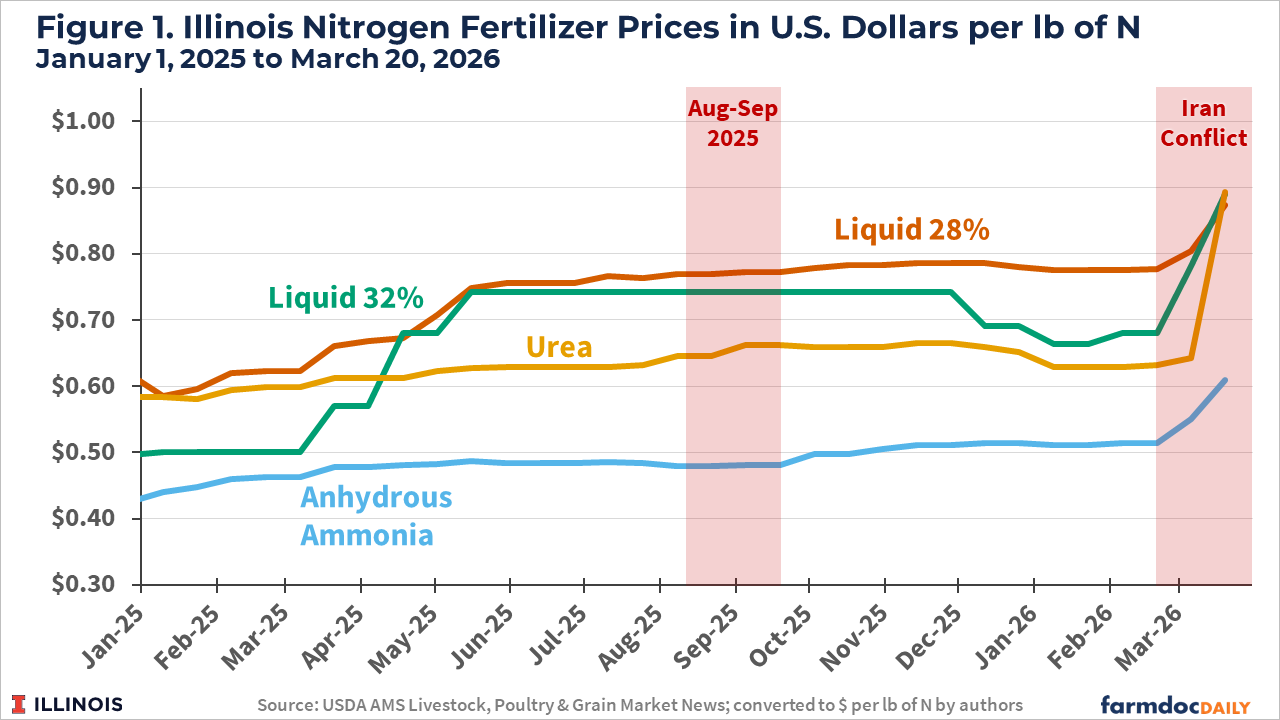
Notably, current prices are also higher compared to those from last year when producers likely began pricing inputs like fertilizers for the 2026 crop year. Over August and September of 2025, anhydrous prices averaged $0.48 per lb of N, liquid solutions averaged $0.77 (28%) and $0.74 (32%), and urea averaged $0.65 (see Figure 1).
Table 1 compares recommendations from the MRTN calculator for central Illinois corn following soybeans and corn following corn. Two pricing scenarios are compared. The first is under ‘Fall 2025’ pricing conditions using $4.15 per bushel for the corn price and $787 per ton anhydrous which translates to a $0.48 per lb price of N. The second is for ‘Spring 2026’ pricing conditions with a $4.50 corn price and $1,000 per ton anhydrous or $0.61 per lb of N.
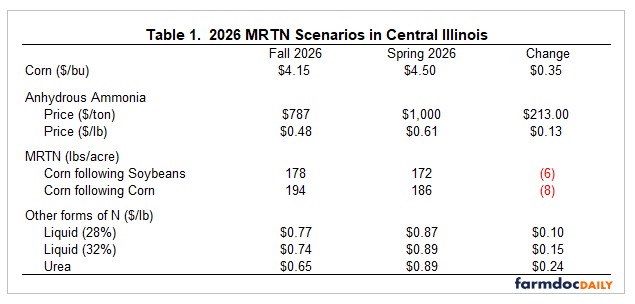
**Fall nitrogen prices based on averages from the August and September 2025 IL Production Cost reports from USDA-AMS. Spring nitrogen prices based on the March 20, 2026 report.
For corn following soybeans the MRTN rate recommendation was 178 lbs of N per acre under Fall conditions and declines to 172 lbs of N per acre under Spring conditions, a reduction of 6 lbs per acre. For corn following corn the rate recommendation declines from 194 to 186, or a reduction of 8 lbs per acre.
An 8 lb per acre reduction in applied N would yield per acre cost savings of nearly $5 per acre at the $0.61 per lb ($1,000/ton) price of anhydrous (8 lbs/acre x $0.61/lb = $4.88/acre). If remaining spring N applications were planned to be done using a liquid solution or urea, per acre savings would increase to just over $7 per acre (8 lbs/acre x $0.89/lb = $7.12/acre). This cost savings may seem small but return margins remain tight, amplifying the importance of controlling control costs. Moreover, $7 per acre over 1000 acres is $7,000.
Savings associated with adjusting remaining N applications to be more in line with the MRTN could be significantly larger for some farms. Data from Precision Conservation Management covering the 10 crop years from 2015 to 2024 shows that, in many cases, farmers may be applying nitrogen at rates that exceed the MRTN by as much as 25-50 lbs per acre. A reduction of 25 to 50 lbs of N per acre could save $15 to $30 per acre at the current $0.61/lb price of anhydrous ammonia. Moreover, spring N applications are more likely to involve the use of liquid nitrogen solutions or granular urea. The potential savings range increases to $22 to $45 per acre when valued at current average prices for these other forms of N, or up to $22,000 to $45,000 in expenses which could be avoided for 1000 acres of corn.
Conclusions
Fertilizer prices have been generally increasing since last year but in particular since the start of the conflict in Iran at the end of February. Higher fertilizer prices increase the value of cost savings that could be achieved by applying nitrogen at rates more in line with MRTN recommendations. Farmers who are still in a position to adjust their total nitrogen applied for the season via remaining spring applications have the potential to at least partially mitigate the increase in their cost of nitrogen fertilizers for corn production.
References
Arita, S., R. Chakravorty, J. Kim, W. Lwin and S. Steinbach. "Strait of Hormuz Closure and Fertilizer Supply Risks for U.S. Agriculture." farmdoc daily (16):48, Department of Agricultural and Consumer Economics, University of Illinois at Urbana-Champaign, March 23, 2026.
Mashange, G. "The Strait of Hormuz: Why Global Trade Dependency Turns a Localized Conflict into a Global Crisis." farmdoc daily (16):52, Department of Agricultural and Consumer Economics, University of Illinois at Urbana-Champaign, March 27, 2026.
Paulson, N., G. Schnitkey, H. Monaco and C. Zulauf. "Nitrogen Prices Remain in Focus After Iran Conflict." farmdoc daily (16):49, Department of Agricultural and Consumer Economics, University of Illinois at Urbana-Champaign, March 24, 2026.
Paulson, N., G. Schnitkey, B. Zwilling and C. Zulauf. "2026 Illinois Crop Budgets." farmdoc daily (15):150, Department of Agricultural and Consumer Economics, University of Illinois at Urbana-Champaign, August 19, 2025.
PCM. 2025. “The Business Case for Conservation, Data Summary for 2015-2024. https://www.precisionconservation.org/wp-content/uploads/2025/06/PCM-Data-Book-2025.pdf
Schnitkey, G., C. Zulauf, N. Paulson and J. Baltz. "The Iran Conflict: Potential Impacts on 2026 Corn and Soybean Returns." farmdoc daily (16):45, Department of Agricultural and Consumer Economics, University of Illinois at Urbana-Champaign, March 17, 2026.
Disclaimer: We request all readers, electronic media and others follow our citation guidelines when re-posting articles from farmdoc daily. Guidelines are available here. The farmdoc daily website falls under University of Illinois copyright and intellectual property rights. For a detailed statement, please see the University of Illinois Copyright Information and Policies here.