


Yield Increases of Grains and Major Crops in the United States
Corn is the primary grain crop in the US and soybeans are the primary oilseed crop. Corn and soybeans have become foundational crops in modern agriculture. Over time, a growing share of US acreage has been planted to corn and soybeans, particularly compared with other grains such as wheat, barley, oats, and rye. Corn yields have increased more than any other major crops grown in the U.S., increasing its competitiveness with the other major grains.
Acres in Major Program Crops
The U.S. Department of Agriculture (USDA) provides baseline projections over the next 10-years for eight major row crops. The farmdoc daily article from April 14, 2026 shows historical acreage from the 1930s to the present. In this article we focus on acreage changes from 1995-1997 to 2024-2026. The 1995 – 1997 period coincides with the passage of the 1996 Farm Bill, often referred to as Freedom to Farm, which eliminated most acreage constraints from previous farm bills. As a result, market forces have largely influenced acreage changes since the mid-1990s. A summary of acreage changes from 1995-1997 to 2024-2026 is:
- Corn acres increased from 77 million in 1995-1997 to 95 million acres in 2024-2026, an increase of 24%.
- Soybean acres increased from 66 million to 84 million, an increase of 29%.
- Wheat acres decreased from 71 million to 45 million, a decrease of 37%.
- Barley acres decreased from 7 million to 2 million, a decrease of 65%.
- Cotton acres decreased from 15 million acres to 10 million, a decrease of 34%.
- Oat acres decreased from 5 million to 2 million, a decrease of 56%.
- Peanut acres increased from 1.4 to 1.8 million, an increase of 24%.
- Rice acres decreased from 3.0 million to 2.7 million, a decrease of 11%.
- Sorghum acres decreased from 11 million to 6 million, a decrease of 41%.
Of those major crops, only three had increases in acres: corn (24%), soybeans (29%), and peanuts (24%). Of those three crops, corn and soybeans are much larger, respectively at 95 million and 84 million acres, compared to 1.8 million for peanuts.
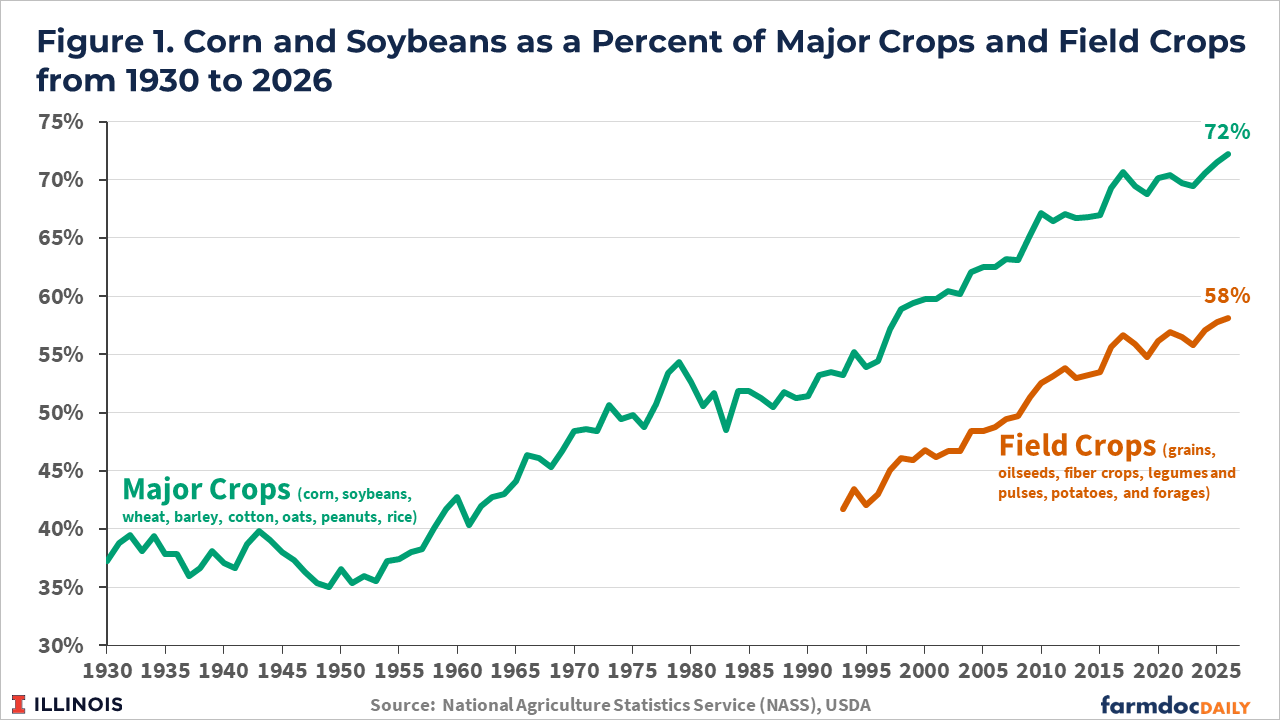
Over time, corn and soybeans have become the two dominant crops in the United States. Corn and soybeans accounted for nearly 40% of the acreage in major crops in the 1930s (see Figure 1). That percentage increased to 55% in 1995 to 1997. Growth continued from 1995 onward, with that percentage over 70% from 2024 to 2026. The USDA began publishing a broader measure of total field crops in 1993 that includes grains, oilseeds, fiber crops, legumes and pulses, potatoes, and forages. In 1993, corn and soybeans were 42% of all field crops planted. From 2024 to 2026, corn and soybeans totaled 58% of total field crop acres (see Figure 1).
Grain crops
These crops fall into categories that have similar uses, with grains being a prime example. Grain crops include corn, wheat, barley, oats, sorghum, rice, and rye, with broad use of grain crops for providing energy. That energy can be used as calories in human and animal diets. While not perfect substitutes, many grains can serve as the energy source in livestock diets. Energy can also be used to produce fuel, primarily in the form of ethanol.
Since the 1930s, corn and wheat have been the two largest grain crops grown in the U.S. (see Panel A of Figure 2). Those two crops had almost equal acres in the 1980s. Since the mid-1990s, corn acres have increased while wheat acres have declined. Three factors contributed to that increase. First, the 1996 Farm Bill eliminated acreage constraints that allowed acreage shifts (see farmdoc daily, March 28, 2025). Second was the introduction of ethanol. While ethanol can be produced from many crops, almost all ethanol is made from grain corn, and policies that incentivized ethanol use resulted in more acres being planted to corn. Third, corn has increased its yields more than the other grain crops, continuously increasing its competitiveness relative to other crops.
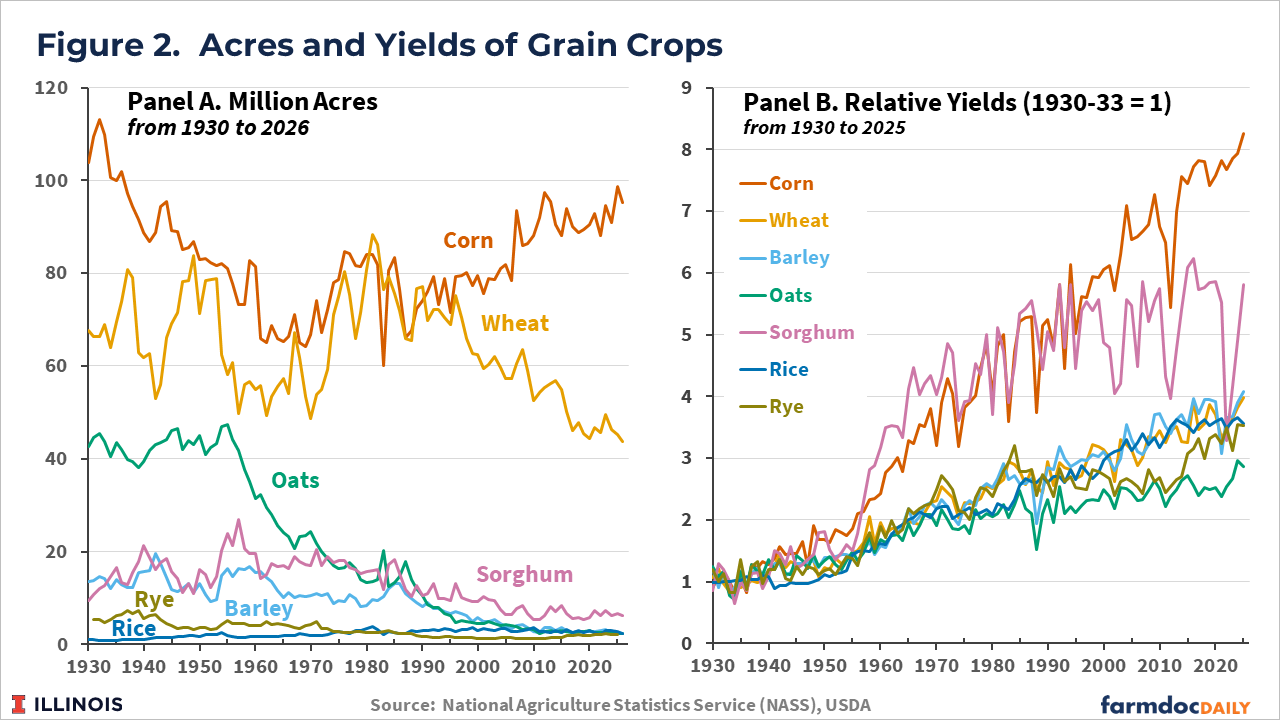
Panel B of Figure 1 shows yearly yields stated in terms of the 1930-33 average. That is, each yearly yield is divided by the 1930-33 average. As a result, all crops began with relative yields of 1.0 in the early 1930s. In 2025, the relative corn yield was 8.3, indicating that corn yield was 8.3 times the yield in 1930-33. In order from the highest to lowest, the 8.3 relative yield for corn in 2025 compared to 5.8 for sorghum, 4.1 for barley, 4.0 for wheat, 3.6 for rice, 3.5 for rye, and 2.8 for oats. Those yields give corn a relative and increasing advantage over the other crops. When substitution can occur between the grains, such as in animal feeds and ethanol production, corn will generally be the lower-cost alternative. As a result, corn has largely become the preferred feed grain, while the other crops are used for specialized uses in which they excel. Wheat, for example, is the preferred grain for breads, pastries, and other bakery products.
Hybridization is relatively straightforward in corn and has been a widely used breeding technique in corn since the late 1940s. Use of hybrids is a reason for the relatively large increases in corn yields. Moreover, corn is currently the only grain crop with widespread adoption of commercial biotechnological traits. Those traits became available in the mid-1990s. Since that time, relative sorghum yields have lagged behind those of corn (see Panel B of Figure 2).
Other Crops
Figure 3 shows acres and yields of other major crops not shown in Figure 2. Soybean acres have increased from less than 4 million acres in the 1930s to over 80 million acres in recent years. Soybeans are the primary oilseed in the United States, providing both meal and oil. On a worldwide basis, soybeans are the dominant oilseed, with other oilseeds being palm, canola, sunflowers, cottonseed, and peanuts. Soybeans were introduced in the U.S. to provide protein in livestock feed and developed into a major U.S. export commodity.
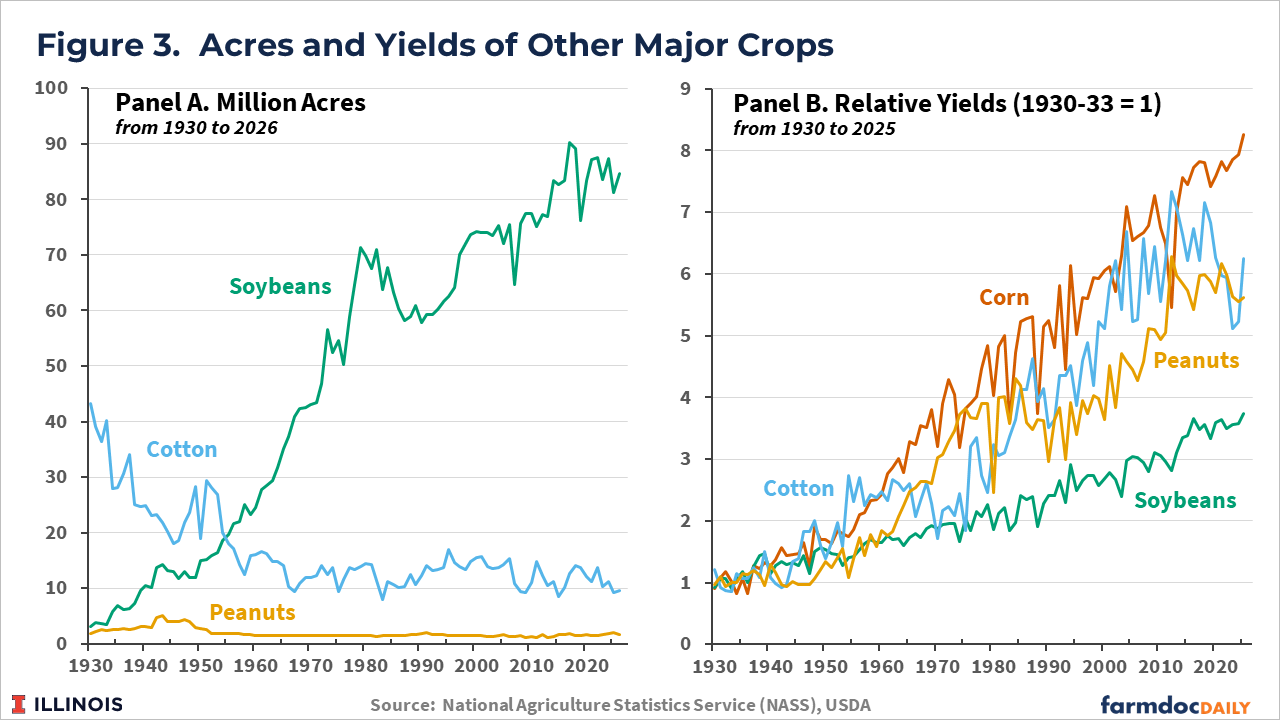
Both cotton and peanut acres have declined. Cotton is used primarily as a fiber crop, with cottonseed also being a source of protein. Peanuts are also a source of protein and have been primarily used in food.
Panel B shows the relative yields of the three crops, with relative corn yields shown for illustrative purposes. None of the three crops has had yield increases matching those of corn, although cotton’s relative yield was close until about 2010. Since 2010, U.S. cotton yields have not grown. Peanut yields have come close to matching the relative growth of corn yields, but since 2010, peanut yields have been relatively stable.
Of the four crops shown in Figure 3, soybean yields have shown the smallest relative increase. Since 2020, relative soybean yields have averaged 3.6, meaning that recent soybean yields are 3.6 times those in 1930-33. Unlike cotton and peanuts, though, soybean yields have continued to increase over the last 15 years.
Summary
While all crops have experienced yield increases since the early 1930s, the size of yield increases have not been the same across all crops. Corn yield has increased more than that of other crops. Those increases have made corn the dominant grain crop in the United States, explaining the increased share of U.S. acres planted to corn relative to other crops, particularly wheat.
Soybean acres have also increased, though relative yield increases are not necessarily an explanatory factor. Acreage increases for soybeans are due more to increased demand for livestock feed, particularly in export markets. Acres of other oilseeds have also generally increased over time, but remain relatively low.
Corn being the dominant grain and soybean the dominant oilseed has led to those two crops having a growing share of major crop acres in the U.S. That trend has raised concerns, in part because relying on two crops may indicate a lack of biodiversity and increase the risk of pest-related issues. One grain, for example, may be impacted by a pest while others are not. Still, it is difficult to foresee those trends not continuing to grow. The sheer size of corn and soybeans likely means that genetics companies will devote most of their resources to increasing yields and development of other beneficial traits in those two crops, perhaps further increasing their competitiveness with alternative crops. In the end, the U.S. acreage share devoted to other grains and oilseeds will continue to be determined by the demand in markets to which those crops contribute.
References
Paulson, N., G. Schnitkey, J. Coppess, C. Zulauf and R. Goodrich. "Historical View of U.S. Row Crop Acreage." farmdoc daily (16):64, Department of Agricultural and Consumer Economics, University of Illinois at Urbana-Champaign, April 14, 2026.
Zulauf, C., G. Schnitkey, J. Coppess and N. Paulson. "US Farm Program Crops in the Planting Flexibility Era." farmdoc daily (15):58, Department of Agricultural and Consumer Economics, University of Illinois at Urbana-Champaign, March 28, 2025.
Disclaimer: We request all readers, electronic media and others follow our citation guidelines when re-posting articles from farmdoc daily. Guidelines are available here. The farmdoc daily website falls under University of Illinois copyright and intellectual property rights. For a detailed statement, please see the University of Illinois Copyright Information and Policies here.