


Conventional and Organic Enterprise Net Returns
Information pertaining to the relative profitability of conventional and organic production is often lacking. A previous article compared net returns for conventional and organic crop enterprises using FINBIN data from 2019 to 2023 (Langemeier, 2024). This article uses FINBIN data from 2021 to 2025 to update comparisons of crop yields, gross revenue, total expense, and net returns for conventional and organic alfalfa, corn, oats, soybeans, and winter wheat. The organic enterprise data represents farms that have already transitioned to organic production, and thus, do not include information pertaining to the transition phase.
Crop Yields
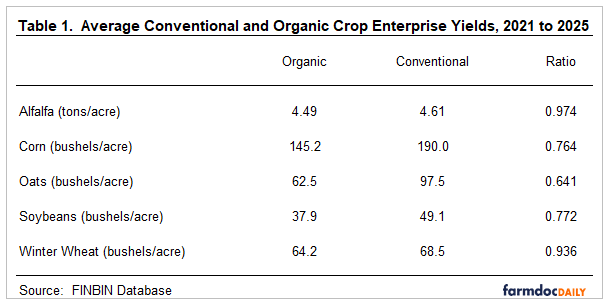
Table 1 shows the average conventional and organic crop yields for alfalfa, corn, oats, soybeans, and winter wheat. The ratio illustrated in the last column of the table was computed by dividing the organic crop yield by the conventional crop yield. Alfalfa exhibited the smallest difference in crop yields (3 percent) between conventional and organic crops. The yield drags for corn, oats, soybeans, and winter wheat were 24 percent, 36 percent, 23 percent, and 6 percent, respectively.
Gross Revenue, Total Expense, and Net Return to Land
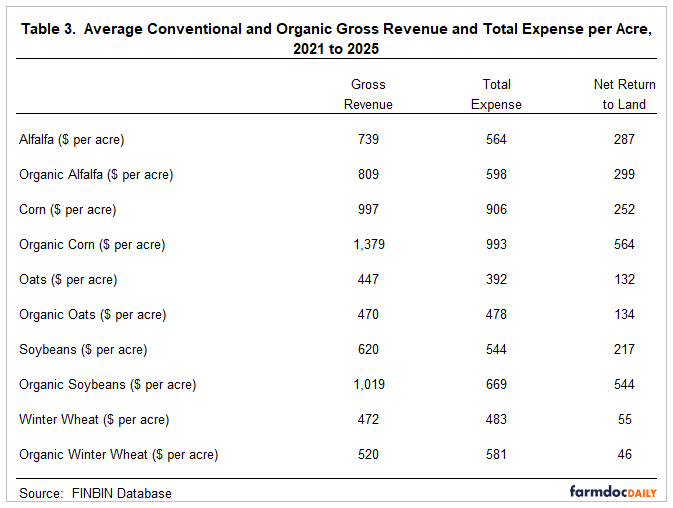
Gross revenue, total expense, and net return to land per unit (per acre) for alfalfa, corn, oats, soybeans, and winter wheat are presented in Table 2 (Table 3). Gross revenue includes crop revenue, crop insurance indemnity payments, government payments, and miscellaneous income. Total expenses include all cash and opportunity costs, other than those associated with owned farmland. Farmland costs included in the total expense reported in Table 2 and Table 3 were comprised of cash rent, real estate taxes, and interest, which would be lower than the full opportunity cost on owned land. Just to give the reader some idea as to how large this excluded cost may be, you would need to add an estimated $0.26 per bushel ($0.91 per bushel) to the total expense for conventional corn (conventional soybeans) if you wanted to account for the full opportunity cost on owned land. Also, note that the per unit and per acre net returns presented in Table 2 and Table 3 represent a net return to land rather than an economic profit.
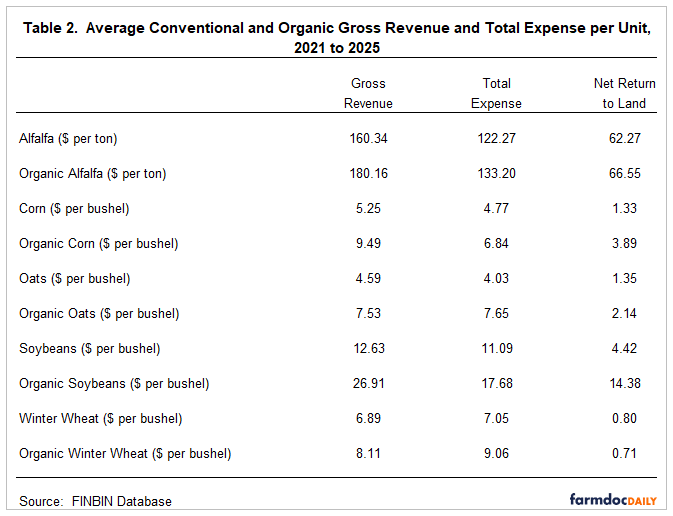
Though conventional and organic crops face different market phenomena, it is common to compare conventional and organic gross revenue per unit and crop prices, total expenses, and net return to land on a per acre basis. Comparing organic to conventional gross revenue per unit reported in Table 2, the smallest ratio of organic to conventional gross revenue per unit was for alfalfa (1.12) and the largest ratio (2.13) was for soybeans. Organic oats and winter wheat gross revenue per unit were 1.64 and 1.18 times their conventional counterparts, while the organic corn gross revenue per unit was approximately 1.81 times higher than the conventional corn gross revenue per unit. The gross revenue per unit ratios reported in Table 2 represent five-year averages. The gross revenue per unit and crop price ratios for individual crops vary from year to year. For example, during the 2021 to 2025 period, the corn price ratio ranged from 1.67 in 2022 to 2.07 in 2025, and soybean price ratio ranged from 1.81 in 2023 to 2.36 in 2021. Total expense per unit (breakeven price) was higher for each of the organic enterprises than their organic counterpart. Compared to the other enterprises, the difference in total expense per unit was relatively small for alfalfa. Given the small yield gap for alfalfa, this result is not surprising.
It is important to note that the net returns reported in Table 2 are on a per-unit basis. Given the differences in crop yields between conventional and organic crops, it is often more relevant to examine differences in per acre expenses and net returns than per-unit expenses and net returns. When compared to the individual conventional crop enterprises, the organic crop enterprises had higher expenses per acre. The average difference in net returns to land between the organic and conventional crops was $129 per acre. The largest difference was $327 per acre for soybeans. The difference for corn was $312 per acre. The differences for alfalfa, oats, and winter wheat were $12, $2, and -$9 per acre, respectively, indicating that conventional alfalfa and oats were more profitable than organic alfalfa and oats. Organic wheat was less profitable than conventional winter wheat. The lack of profits for the organic small grains and forages has important implications for organic crop rotations. Most organic crop rotations include a small grain or a forage such as alfalfa in the rotation. Market opportunities for organic small grains and forages vary substantially by region, and it can be difficult to find markets for these crops.
Difference in Net Returns Among Farms
The results above focus on differences in average net return to land. Economists have long pointed out the large differences in financial performance among farms. To account for the differences among farms, we used the FINBIN database to examine net returns for conventional and organic corn and soybean enterprises.
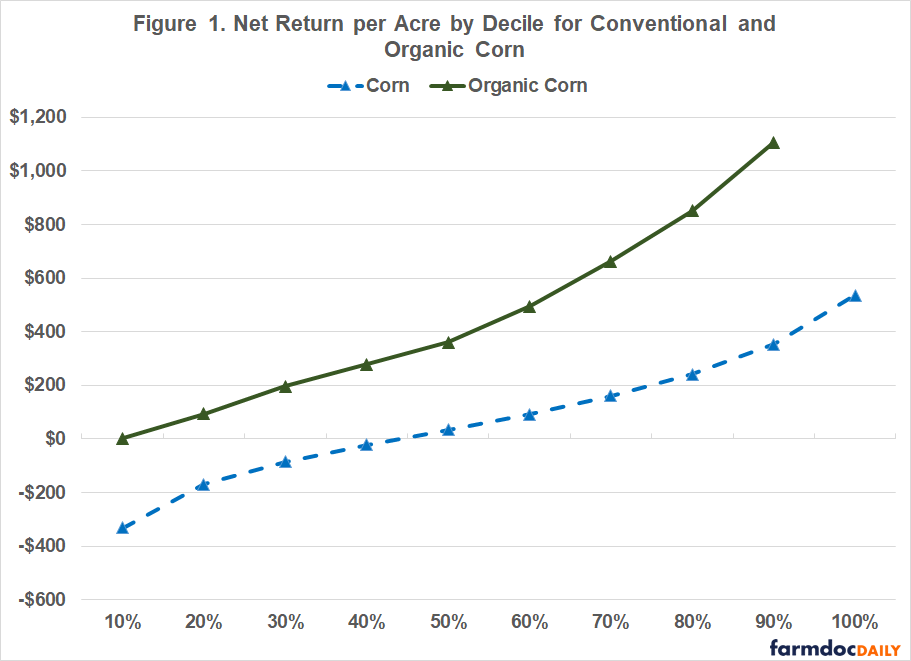
Figure 1 presents the comparisons among enterprise deciles (ten equal groups) for conventional and organic corn using 2021 to 2025 FINBIN data. Net return in this figure represents net return over labor and management and includes all cash and opportunity costs other than the opportunity cost on owned land. The median net returns per acre for conventional corn and organic corn were $62 and $315, respectively. The difference in net return per acre for the bottom and top deciles was $866 for conventional corn and $1,427 for organic corn. Despite the larger median net return, it is important to note that there were quite a few organic farms with lower net returns for corn than their conventional counterparts in the top deciles.
Comparisons among enterprise deciles for conventional and organic soybeans are presented in Figure 2. The median net returns using FINBIN data for the 2021 to 2025 period for conventional soybeans and organic soybeans were $70 and $335, respectively. The difference in net return per acre for the bottom and top deciles was $581 for conventional soybeans and $1,104 organic soybeans. Even though the median net return for organic soybeans is higher than the median net return for conventional soybeans, the organic producers in the lowest decile had net returns that were very similar to those for conventional soybean producers in the lowest decile.
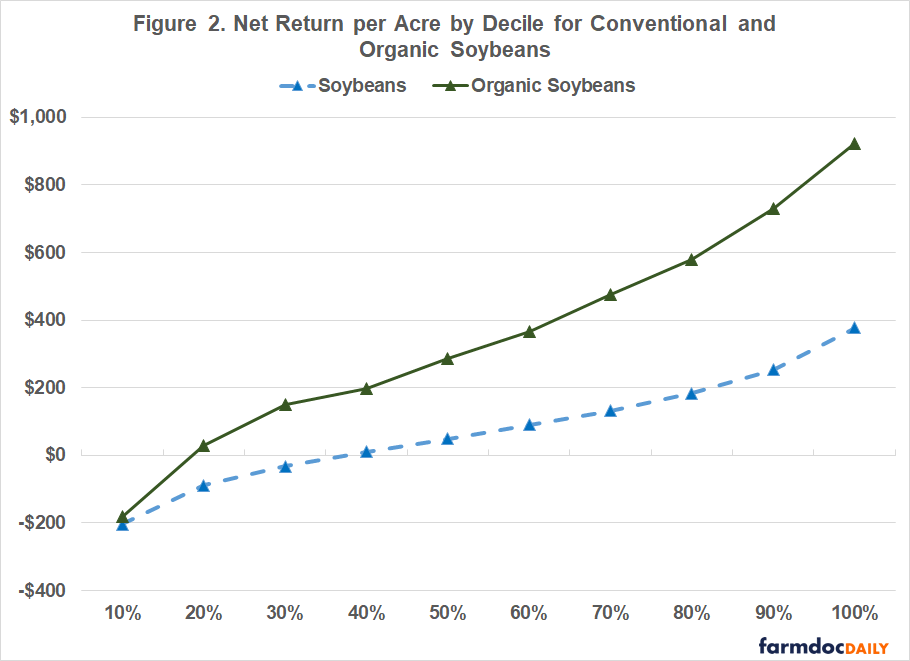
What can we make of the results in Figures 1 and 2? First, there is a larger difference in net returns between the organic producers than there is between the conventional producers. This result could be due to learning effects or the more complicated rotations associated with organic crop production. Second, obtaining a boost in net returns from organic soybean production appears to be much more difficult than it is for organic corn. This could be due to weed control issues often encountered when producing organic soybeans. The results in Figures 1 and 2 stress the importance of examining the sensitivity of budgeted net returns for organic crops to changes in price, yield, and cost assumptions before transitioning acres.
Summary and Conclusions
This article compares crop yields, gross revenue, total expense, and net returns for conventional and organic corn and soybeans. FINBIN data (Center for Farm Financial Management, 2026) were used to make the comparisons in this article. Consistent with previous work, organic corn and soybean enterprises had lower crop yields, higher crop prices and gross revenue, higher total expenses, and higher net returns. However, there was a much wider difference in enterprise net returns among organic corn and soybean enterprises than there was among conventional corn and soybean enterprises. It is also important to note that on average alfalfa, oats, and winter wheat grown conventionally had similar net returns to those grown within an organic cropping system.
This article summarizes net returns for conventional and organic crop enterprises. It did not examine net returns during the transition period, nor did it account for the fact that unlike many conventional rotations, organic crop rotations tend to include small grains and/or forages. Thus, it is very important to not just compare net returns for corn and soybeans grown conventionally and organically. For comparisons of conventional and organic crop rotations see Langemeier et al. (2020) and Langemeier and O’Donnell (2021).
References
Center for Farm Financial Management, University of Minnesota, FINBIN web site, accessed May 27, 2026.
Langemeier, M. "Conventional and Organic Enterprise Net Returns." farmdoc daily (14):124, Department of Agricultural and Consumer Economics, University of Illinois at Urbana-Champaign, July 3, 2024.
Langemeier, M., X. Fang, and M. O’Donnell. “Comparison of Long-Run Net Returns of Conventional and Organic Crop Rotations.” Sustainability. 12(Issue 19, 2020):1-7. https://doi.org/10.3390/su12197891
Langemeier, M. and M. O’Donnell. “Comparative Net Returns for a Forage-Based Organic Crop Rotation.” Current Investigations in Agricultural and Current Research. 9 (Number 4, 2021):1256-1262.
Disclaimer: We request all readers, electronic media and others follow our citation guidelines when re-posting articles from farmdoc daily. Guidelines are available here. The farmdoc daily website falls under University of Illinois copyright and intellectual property rights. For a detailed statement, please see the University of Illinois Copyright Information and Policies here.