








A Pre- and Post-Report Look at the 2026 U.S. Corn Yield
USDA’s August Crop Production report, released August 12, 2026, provided the first survey-based corn yield forecast of the season, based on USDA’s Agricultural Yield Survey, in which producers report their expected yields based on current field conditions. USDA’s Objective Yield Survey, in which NASS enumerators take physical plant and ear counts directly from sample fields, does not begin field work until late August, so those physical measurements will not factor into USDA’s forecast until the September Crop Production report.
This article presents a forecast for the 2026 U.S. corn crop that has been independently developed based on crop conditions. It also compares this forecast to the numbers reported by the USDA. This forecasting method is not new for this crop year; it has been updated weekly since late May, utilizing the USDA NASS’s weekly crop condition ratings. The forecast offers a valuable point of comparison because it is constructed differently from the USDA’s survey-based approach. Instead of using direct field sampling or farmer surveys, it relies solely on published condition ratings and historical yield relationships at the state level. For readers unfamiliar with this forecasting approach, a description of the methodology is provided below, along with the forecast and a direct comparison with the USDA’s actual numbers from August.
The Forecasting Model
The forecast model employs a trend-and-condition approach at the state level, focusing on each of the 18 leading corn-producing states individually. For each state, corn yield is modeled as a function of a long-term linear time trend, which is updated as the final yield for each season becomes available. Additionally, the model incorporates the state’s current-season weekly crop condition ratings, as reported by USDA NASS on a standard five-point scale (very poor, poor, fair, good, excellent). The past 30 years of crop condition reports are used in a regression model to estimate deviations from trend yield.
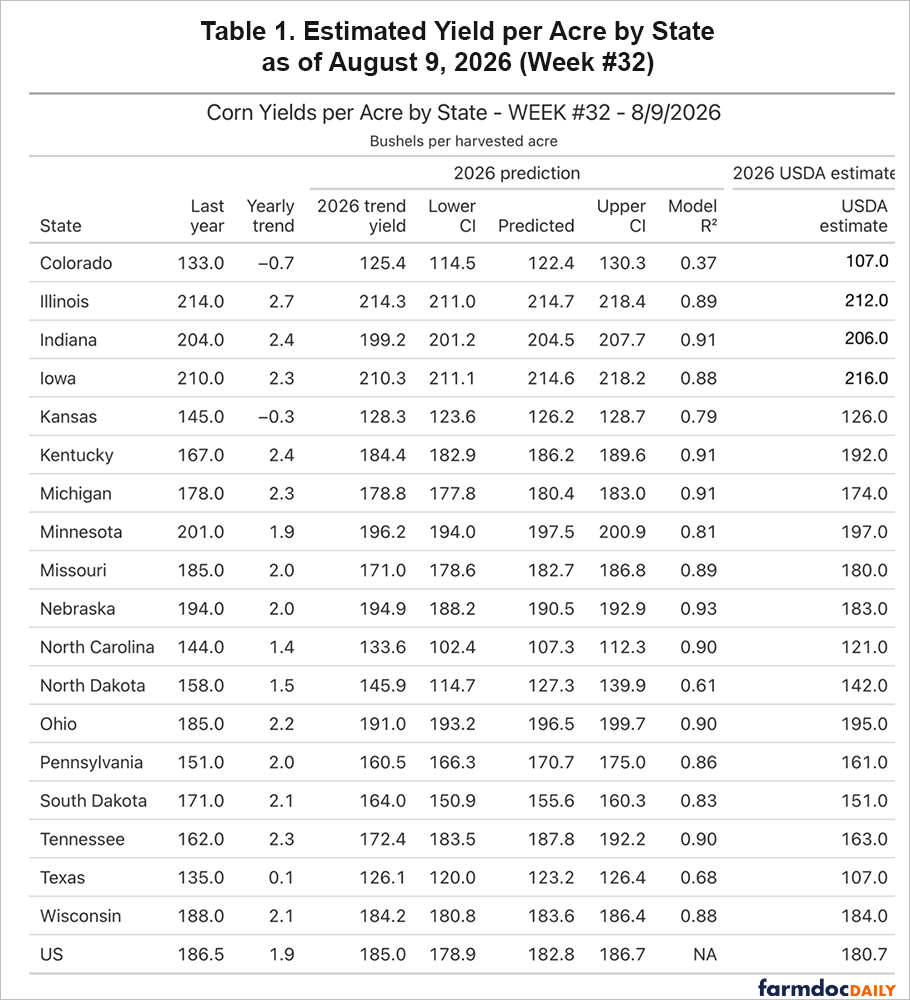
As the growing season advances and more weekly condition reports are compiled, the model’s accuracy in predicting that state’s yield typically improves. Each state’s model fit is represented by an R-squared value (see Table 1), which indicates how well the model explains variation in actual yield outcomes. This value can vary significantly between states and throughout the season.
It’s important to interpret states with a low current-season R-squared value with caution, as opposed to those where the model has historically tracked yield outcomes closely. However, it’s worth noting that even a strong R-squared does not guarantee accuracy in any given year.
Each state’s forecast includes a predicted yield along with lower and upper bounds, derived from the model’s confidence interval. State-level production is calculated as predicted yield multiplied by predicted harvested acreage. Harvested acreage itself is not currently forecast by the model; it is taken directly from the USDA’s most recent official acreage figure and held fixed until the USDA revises it. National production is the sum of production across the 18 modeled states, scaled up to a full U.S. total using the historical relationship between those states and total U.S. production. National yield is total production divided by total harvested acreage, rather than a simple average of state yields, thereby avoiding the overweighting of smaller-acreage states.
The Forecast Heading Into the Report
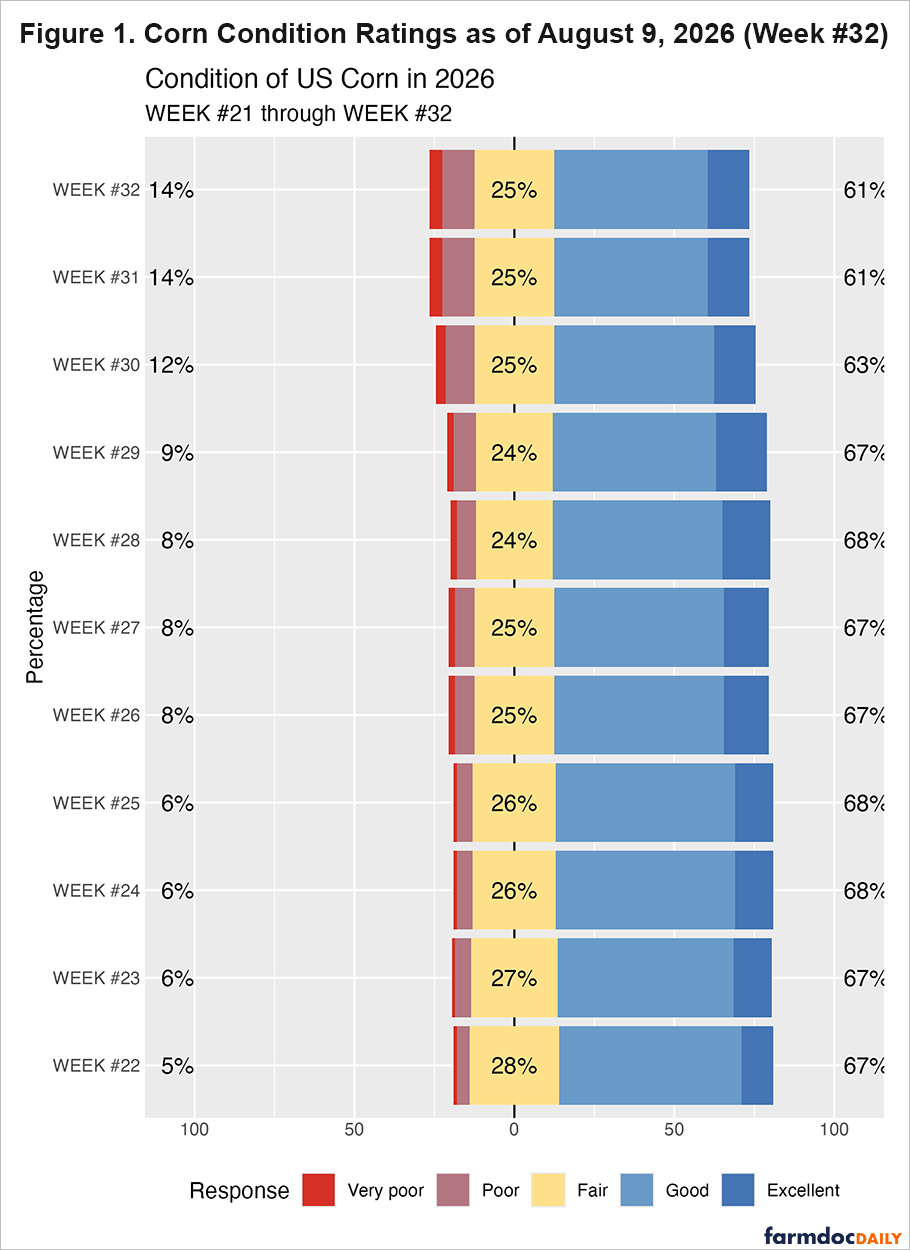
As of the week ending August 9, 2026 (crop week #32), the last full update before USDA’s release, the model’s national estimates stood at a predicted yield of 183.0 bu/ac (range 179.1 to 186.8), on harvested acreage of 87,434 thousand acres carried over from the June Acreage report, for predicted production of 15,997 million bushels. For comparison, the final 2025 U.S. corn yield was 186.5 bu/ac on 91,258 thousand harvested acres, for a total production of 17,021 million bushels. Figure 1 shows the steady deterioration in national crop conditions over the back half of the season: the good-and-excellent share fell from 68% in week #28 to 61% by week #32, while poor-and-very-poor rose from 8% to 14% over the same stretch, consistent with the model’s yield estimate easing off its late-July peak.
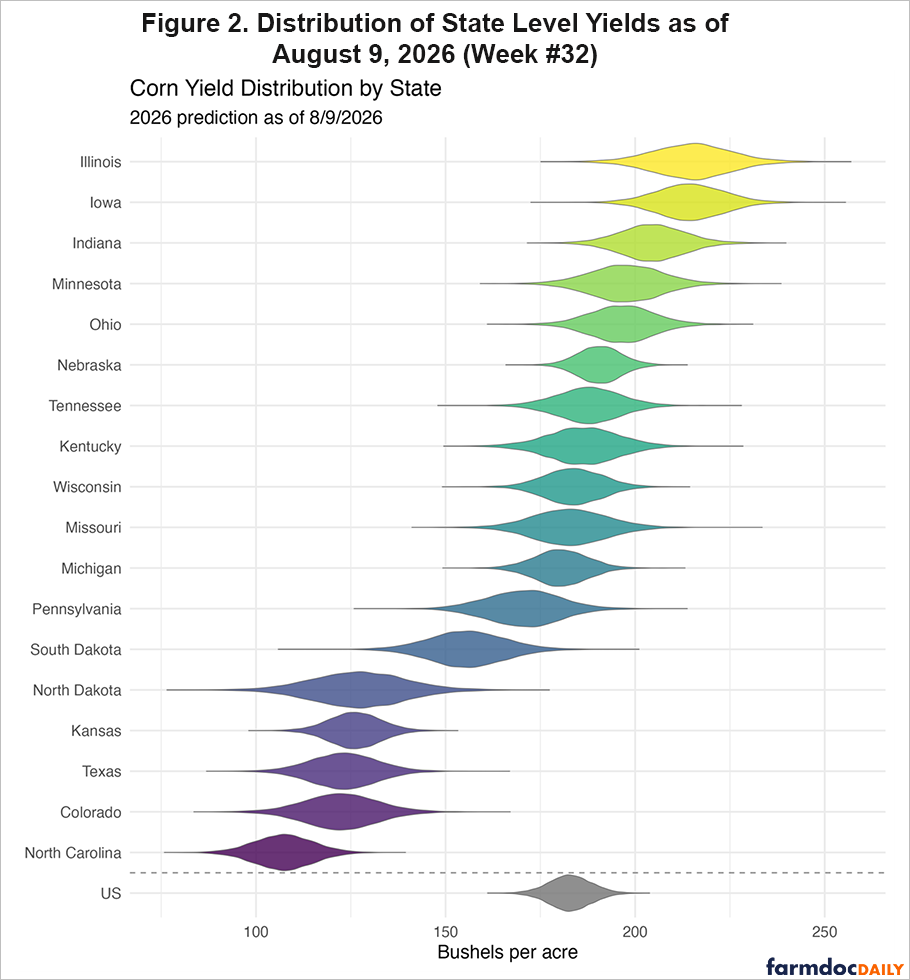
State-level detail heading into the report is provided in Table 1. Nebraska (R-sq = 0.93), Indiana (0.91), Kentucky (0.91), Michigan (0.91), Illinois (0.89), Missouri (0.89), and Tennessee (0.90) carried the strongest model fits among the 18 states, while Colorado (0.37) and North Dakota (0.61) carried the weakest and were flagged as the states to read with the most caution. Figure 2 presents the model’s full predicted yield distribution for each state as a violin plot, with the national distribution shown at the bottom for reference; Iowa and Illinois stood out as the two highest-yielding large states, while North Carolina, Colorado, Texas, and North Dakota anchored the low end.
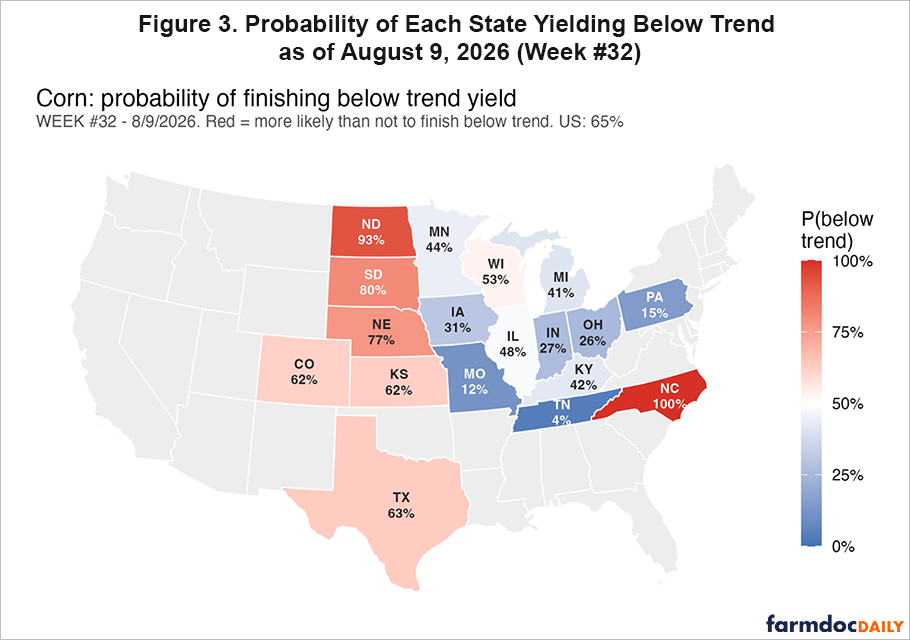
Underneath the national numbers, the season’s real story was North Dakota. The state’s yield estimate moved from roughly on-trend in late May to 19 bu/ac below its own trend line by early August, the largest such gap in the model other than North Carolina, which had run well below trend since June. Tennessee, Missouri, and Pennsylvania moved in the opposite direction, climbing from below-trend readings early in the season to 10-15 bu/ac above trend by early August. Figure 3 shows the resulting state-level probability of finishing below trend as of the week #32 update: North Dakota stood at 93%, South Dakota at 80%, and North Carolina effectively at 100%, while Missouri (12%), Tennessee (4%), and Pennsylvania (15%) carried the lowest odds of finishing below their own trend lines. Nationally, the probability of the U.S. crop finishing below trend stood at 65% heading into the report.
Comparison to USDA’s August Estimate
USDA’s August Crop Production report put the national corn yield at 180.7 bu/ac, 2.1 bu/ac (1.2%) below the condition-based model’s estimate heading into the report. USDA also raised harvested acreage to 88,592 thousand acres, 1,158 thousand acres above the June Acreage report figure the model had been using, though still 2.9% below last year’s 91,258 thousand harvested acres. Based on USDA yield and acreage estimates, production is 16,013 million bushels.
Rerunning the model with USDA’s updated acreage figure, holding the underlying state-level yield forecasts unchanged, lifts the model’s production estimate to approximately 16,192 million bushels (range 15,847 to 16,538) on a yield of 182.8 bu/ac, a modest national yield shift from 183.0 that reflects the changed mix of acres across states rather than any change in individual state forecasts. That leaves the model running about 186 million bushels, or 1.2%, above USDA’s implied production. Both the model and USDA now agree that 2026 production will fall well short of last year: USDA’s number implies a decline of 5.8 bu/ac (3.1%) in yield and roughly 1.0 billion bushels (6.0%) in production from 2025, somewhat larger declines than the model’s own pre-rerun estimate of a 3.7 bu/ac yield decline and an 826 million bushel production shortfall.
Table 1 provides an informative state-by-state comparison of the model’s estimates against USDA figures. The model generally produced higher yields than the USDA in most states, particularly in Tennessee, where the model estimated a yield of 187.8 bushels per acre (bu/ac), which was 24.8 bu/ac above the USDA’s estimate of 163.0 bu/ac. This discrepancy represents the largest difference in either direction and is noteworthy, given that Tennessee had one of the strongest model fits of the season (R-squared = 0.90). Other states with significant overestimates included Texas (16.2 bu/ac too high), Colorado (15.4 bu/ac too high), Nebraska (7.5 bu/ac too high), and Pennsylvania (9.7 bu/ac too high).
Conversely, the model underestimated yields compared to USDA in North Dakota (14.7 bu/ac too low) and North Carolina (13.7 bu/ac too low). These two states had already been identified before the report as running significantly below their respective trend lines. This observation serves as a useful reminder that when a state deviates substantially from its trend, a trend-based model may struggle to make accurate predictions.
How Much Weight Should the August Number Carry?
A companion analysis (Ibendahl, 2026) examined the historical accuracy of the USDA’s August, September, and October corn yield forecasts against the eventual final yield, using data from 1996 through 2025. That analysis found that USDA’s August forecast has historically missed the final yield by a standard deviation of about 5.3 bu/ac, or roughly 3% at a typical trend yield, narrowing to 4.5 bu/ac in September and 3.0 bu/ac in October, with no statistically meaningful directional bias in any of the three months. Accuracy has also improved since 2011: splitting the 30-year sample in half, the typical August miss fell from 5.1 bu/ac in the earlier period to 3.0 bu/ac from 2012 forward.
The same analysis found that when USDA’s August number misses the eventual final yield in a given direction, the error tends to persist rather than fully correct in subsequent reports: on average, roughly 77% of August’s miss remained in the September report, and roughly 40% remained by October, with correlations between successive months’ errors of 0.86 to 0.91. The one clear exception in the 30-year sample was 2012, when USDA’s August forecast during that year’s severe drought landed within 0.3 bu/ac of the eventual final yield, because the drought’s damage was already fully visible by the time the August survey was conducted.
Set against that history, the 2.1 bu/ac gap between the condition-based model and USDA’s August number is modest, well within one standard deviation of USDA’s typical August miss relative to the final yield. Neither estimate should be treated as settled at this stage of the season. If USDA’s lower number is closer to the eventual outcome, the persistence pattern documented above suggests the model’s states that ran hottest relative to USDA, Tennessee foremost among them, are the ones most likely to see further downward revision in the weeks ahead.
Concluding Comments
USDA’s first survey-based read on the 2026 corn crop came in below both last year’s final yield and the condition-based model’s pre-report estimate, driven mainly by a handful of states, Tennessee, Texas, Colorado, Nebraska, and Pennsylvania, where the model had been running well above what USDA’s growers reported. The acreage revision partially offset the yield gap at the national level, since USDA’s harvested acreage came in higher than the June estimate the model had been using. On net, both approaches now point to a 2026 crop meaningfully smaller than 2025, driven by a combination of reduced yield and, more substantially, several million fewer harvested acres.
The state-level detail also offers a methodological lesson worth carrying into future seasons: a strong within-season R-squared, as Tennessee had, measures how well condition ratings have tracked that state’s yield historically, not how reliable this particular year’s forecast will turn out to be, especially for a state whose year-to-date trajectory looked unusual relative to its own history. North Dakota and North Carolina, the two states flagged all season as running furthest below trend, also turned out to be the two states where the model most underestimated USDA’s number, suggesting some mean reversion in extreme within-season readings is worth building into how these forecasts are interpreted going forward. The condition-based model will continue tracking the crop weekly through harvest, and will be watching USDA’s September report closely to see how much of this month’s gap persists.
Content Note: This article presents a condensed version for farmdoc daily readers, using four of those figures. The full weekly forecast series, including all state-level tables and the complete set of 17 supporting charts, is published at agricultural.substack.com.
Methodology Note: yield forecasts come from a state-level trend-and-condition model; “predicted” values carry lower/upper confidence intervals, and model fit (R-sq) is reported per state so readers can weight each call accordingly. Production = predicted yield x predicted harvested acres. Condition categories follow the standard USDA NASS five-point scale (very poor, poor, fair, good, excellent). All figures are as of crop week #32.
References
Ibendahl, G. “How Much Should You Trust USDA’s August Corn Number? Here’s 30 Years of Evidence.” Agricultural Economics (Substack), August 10, 2026. https://agricultural.substack.com/p/how-much-should-you-trust-usdas-august
Disclaimer: We request all readers, electronic media and others follow our citation guidelines when re-posting articles from farmdoc daily. Guidelines are available here. The farmdoc daily website falls under University of Illinois copyright and intellectual property rights. For a detailed statement, please see the University of Illinois Copyright Information and Policies here.