








Changing Nitrogen Rates on PCM Farms: Implications for 2027 Nitrogen Decisions
Average nitrogen rates used on farms enrolled in Precision Conservation Management (PCM) have varied little across years. The high nitrogen fertilizer prices suggest that application rates above economically optimal levels could be more costly this year than in other years, implying strong economic incentives to lower application rates. However, PCM data suggest that nitrogen rates across farms do not change much year to year or in response to fertilizer price.
Background
Prospects are for much higher nitrogen prices compared to recent years (see farmdoc daily, August 11, 2026). In the September 19th release of the Illinois Production Cost Report, the average anhydrous ammonia price for retail prices in Illinois was $908 per ton. At $908, the price is $119 higher than anhydrous ammonia last year at this time and $239 per ton higher than two years ago. A $908 price is uncommonly high, occurring in only once in the last ten years, in a period from early 2022 through the end of 2022, during the initial stages of hostilities between Ukraine and Russia. Given high nitrogen fertilizer prices, application rates above those which are economically optimal can reduce returns more than usual.
The University of Illinois’s nitrogen rate recommendation system for corn production is called the Maximum Return to N Rate (MRTN) rate and is available online through the Corn Rate Calculator. The website provides nitrogen rates and ranges for northern, central, and southern Illinois. Annual recommendations are developed through in-field nitrogen rate field trials and identify the nitrogen rate that maximizes profitability from nitrogen applications. These MRTN rates do not always maximize corn yields but, rather, are developed to identify the nitrogen fertilizer rate that maximizes financial return on nitrogen fertilizer. We used the nitrogen rate calculator to find MRTNs for 2027. The calculator requires entries of the expected corn price and expected nitrogen fertilizer costs. To develop the following rates, we used corn prices of $5.00 per bushel and anhydrous ammonia costs of $900 per bushel. Those rates result in MRTNs of
- Northern: 184 pounds of actual nitrogen
- Central: 181 pounds of actual nitrogen
- Southern: 204 pounds of actual nitrogen
The MRTN has not changed much over time. For example, we have calculated MRTNs every year from 2015 to 2025. In Central Illinois, the MRTN has ranged from 163 pounds to 198 pounds per acre.
Profitability results from Precision Conservation Management (PCM) indicate that the MRTN range does result in the highest return outcomes. PCM is a farmer-led program that combines field-level data analysis with one-on-one technical assistance to help farmers make profitable, environmentally sustainable farming practices. We calculated the average operator and land return — a measure of profitability equaling gross revenue minus non-land costs — for different categories of nitrogen rates
- 125 to 150 pounds of N per acre — a category below the MRTN,
- 151 to 175 pounds — a category at the lower end of the MRTN,
- 176 to 200 pounds — a category where most MRTNs fall,
- 201 to 225 pounds — a category above the MRTN, and
- 226 to 250 pounds — a category well above the MRTN.
Table 1 shows returns for these six categories for each year from 2020 to 2025. Farms in this summary are located in Central Illinois and have Soil Productivity Ratings above 130. It also shows the average across all six years. The category with the highest return is the 151 to 175 category, at $409 per acre, with the 176 to 200 category having slightly lower returns at $401 per acre The two higher-rate categories have lower returns: the 201 to 225 rate category is $22 below the 151 to 175 category at $387 per acre, and the 226 to 250 rate category was $36 per acre lower at $373 per acre.
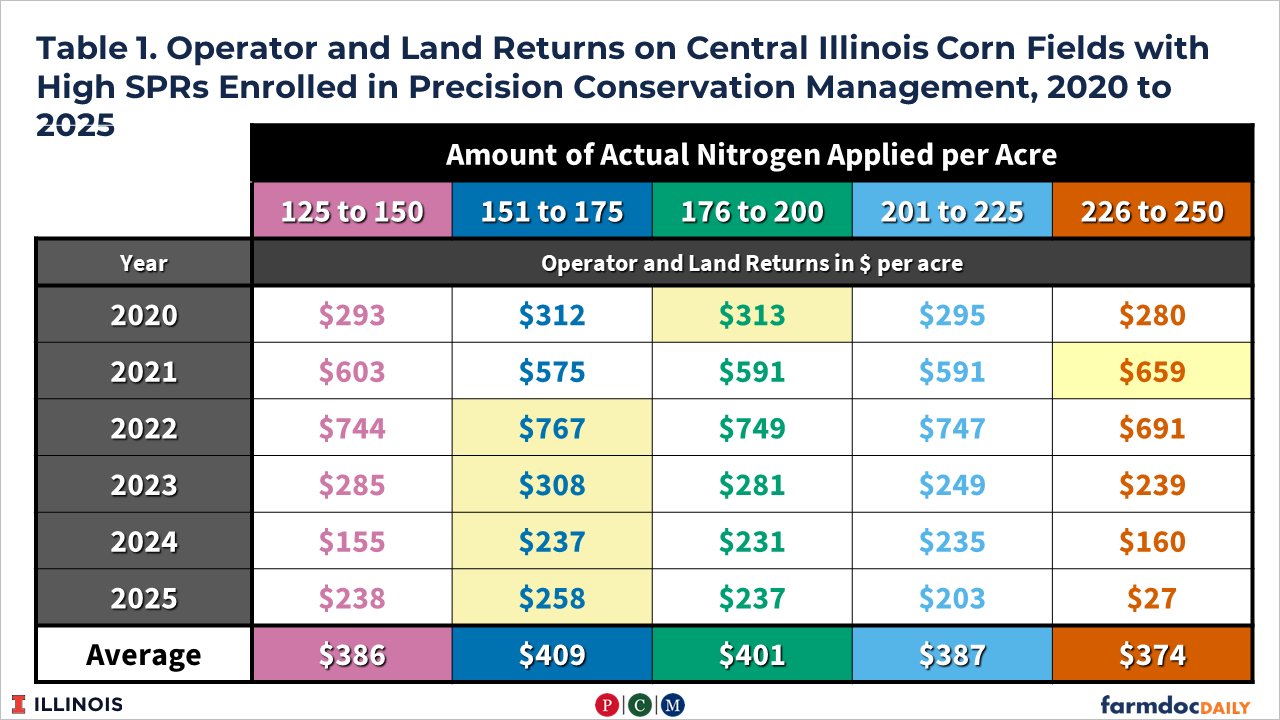
In five out of six years, either the 151 to 150 or the 176 to 200 categories had the highest returns. The 226 to 250 category had the highest returns in 2021 at $659 per acre, well above the other categories. In that year, corn prices were relatively high, averaging $6.00 across the U.S., while anhydrous ammonia prices were below $700 per ton. At this point, 2027 does not look set up to be like 2021.
Farmer Decision Making on Nitrogen Rates
Overall, the average nitrogen application rates used by participating farmers have not varied much since the beginning of PCM in 2015 (see Figure 1). From 2015 to 2025, nitrogen rates for central Illinois farms have averaged from a low of 201 pounds per acre to a high of 207 pounds per acre. Overall, average nitrogen application rates show no clear trend. The lowest average rate, 201 pounds per acre, occurred in 2019 and was likely influenced by the wet year, which delayed planting on many farms. Typically, many farms have nitrogen application rates above the MRTN, with 61 percent of farms having rates above 200 pounds per acre in 2025
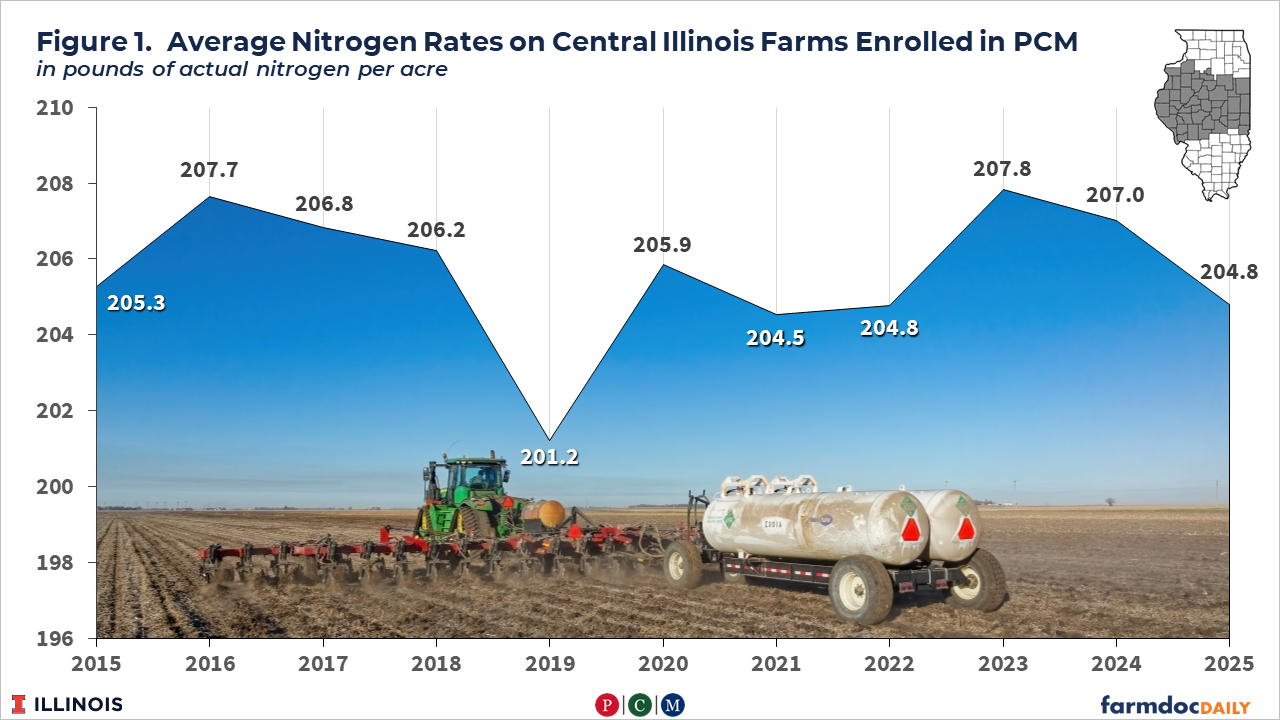
Figure 2 shows a scatter of nitrogen rates for 2024 and 2025. Each point represents the 2024 rate on the horizontal axis and the 2025 rate on the vertical axis. If farms fall on the dotted line, their rates are the same in both years. Figure 2 visually depicts how each farmer’s rate changed.
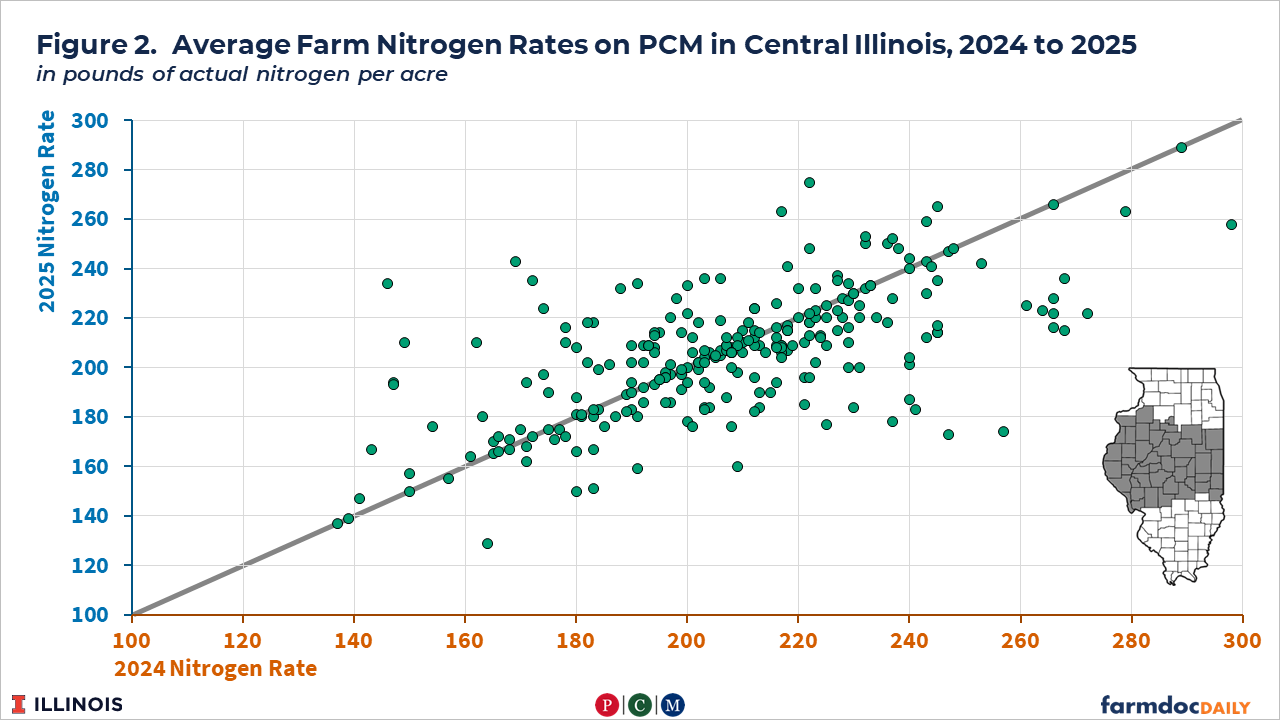
Figure 2 illustrates several points. First, many farmers used roughly the same rate in one year as in the next year. The correlation coefficient between 2024 and 2025 is .65, indicating a relatively strong correlation between rates in one year and the next. The 2025 rate is within 5 pounds of the 2024 rate on 38% of farms and within 5 to 10 pounds on 13% of farms. Overall, rates in 2025 were within 10 pounds of the 2024 rate on 51% of the farms.
Second, there is no discernible pattern in rate changes. Some farms increased rates, while about as many decreased them. Overall, the average rate across farms did not change much between years: 207 pounds in 2024 and 204 pounds in 2025. Hence, farms that increased rates were largely offset by those that decreased rates.
Results from other years show similar patterns. Most farms are close to their previous rates, but some farms have larger changes. About as many farms increase rates as decrease them, leading to roughly the same average nitrogen rate across farms.
Summary
Nitrogen rates released by the University of Illinois suggest that many farms could improve profitability by reducing nitrogen fertilizer rates and moving to the MRTN. MRTN results are corroborated by return studies using PCM data. Moving to MRTN rates this year may have larger impacts on profitability, as nitrogen fertilizer prices are high.
PCM farmers know about MRTNs but average application rates suggest many farmers have chosen not to adopt those rates. Over time, rate increases on some farms have offset rate decreases on others. The reason for this is unclear at this point. Searching for an answer may be worthwhile, as results suggest farmers could improve profitability. Moreover, reducing nitrogen rates may have societal benefits as lowering rates could also reduce nutrient losses from the soil, lowering nitrates entering water bodies.
References
Paulson, N., G. Schnitkey, R. Batts, B. Zwilling and C. Zulauf. "Fertilizer and Fuel Prices Higher Heading into Fall 2026." farmdoc daily (16):143, Department of Agricultural and Consumer Economics, University of Illinois at Urbana-Champaign, August 11, 2026.
Disclaimer: We request all readers, electronic media and others follow our citation guidelines when re-posting articles from farmdoc daily. Guidelines are available here. The farmdoc daily website falls under University of Illinois copyright and intellectual property rights. For a detailed statement, please see the University of Illinois Copyright Information and Policies here.