


FSA Yields Used in Computing ARC-CO Payments Compared to NASS Yields
The Farm Service Agency (FSA) computes county yields used in calculating Agricultural Risk Coverage–County Option (ARC-CO) payments. FSA yields differ from county yields released by the National Agricultural Statistical Service (NASS); however, these NASS yields will be useful in estimating 2015 ARC-CO payments. NASS likely will release 2015 yields in February 2016 while release of FSA could be as late as autumn of 2016. Many farmers, lenders, and landowners will desire payment estimates before the autumn. In many cases, NASS yields can be used to arrive at realistic estimates of ARC-CO payments. To aid in ARC-CO payment estimation, the average differences between FSA and NASS yields are reported in this article for corn in Illinois counties.
Average Differences in FSA and NASS yields
FSA uses the NASS data in calculating county yields where NASS data exists. However, NASS data is supplemented with data from the Risk Management Agency (RMA) on failed acres for corn and several other crops. NASS county yield equals:
- NASS county production / NASS county harvested acres.
FSA county yield equals:
- NASS county production / (NASS county harvest acres + RMA county failed acres).
If RMA failed acres equal zero, FSA yield equals NASS yield. As RMA failed acres increase, FSA yield will decrease relative to the NASS yield. Because of these relationships, FSA and NASS yield comparisons given below depict the level of failed acres. Counties with few failed acres will have FSA yields very close to NASS yields. FSA yields will be below NASS yields as failed acres increase.
FSA and NASS yields were compared using six years of data. FSA released 2009 through 2013 yields in early 2015 for use in calculating 2015 ARC-CO benchmark yields. In October 2015, the 2014 FSA yields were released. These FSA yields were compared to NASS yields. NASS yields were obtained through “Quick Stats” on the NASS website. In making the following comparisons, NASS yields were rounded to the nearest whole number (176.6 became 177), thereby matching the rounding conventions of FSA.
Figure 1 shows the average difference between FSA and NASS yields. A -6.0 value means that FSA yields average 6 bushels per acre less than NASS yields from 2009 to 2014. Values are reported for all counties where four years of differences can be calculated. A yield comparison could not be conducted for two reasons:
- NASS did not release a county yield for a given year. NASS does not release county yields unless certain statistical criteria are met.
- FSA use 70% of the t-yield for the county yield. If the county yield is less than 70% of the t-yield, 70% of the t-yield is used in ARC-CO benchmark comparisons. In years when a t-yield was used, FSA did not release the actual county yield, instead releasing 70% of the t-yield. When the actual FSA county yield was not released, a comparison between FSA and NASS yields could not be made. In 2012, many county yields were below 70% of the t-yield. Hence, 2012 was not used in calculating average difference for many Illinois counties.
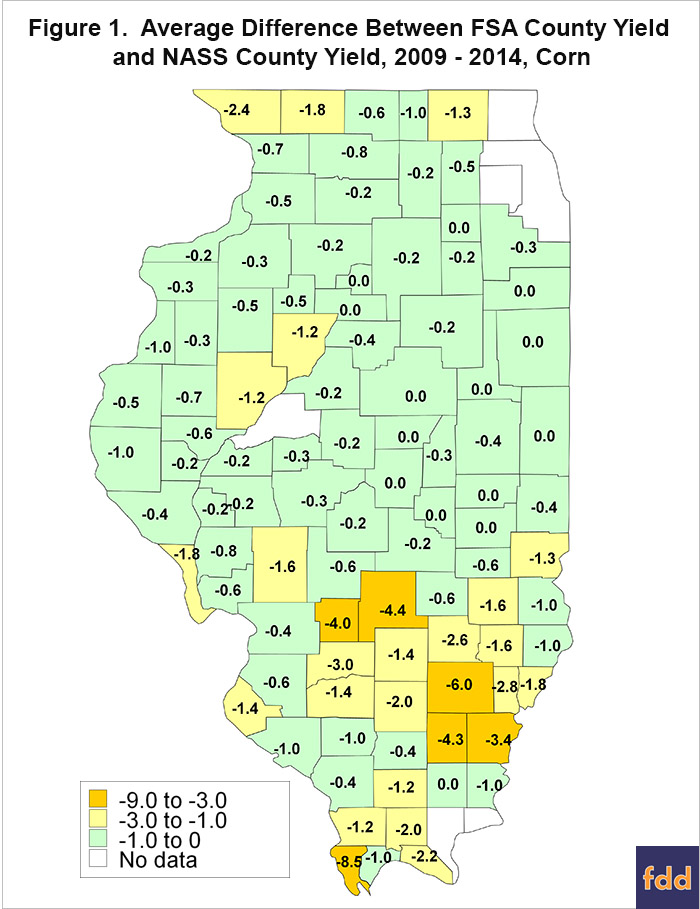
As can be seen in Figure 1, differences between FSA and NASS yields are relatively small in most cases. Throughout much of northern and central Illinois, yield differences average less than a bushel per acre. These counties tend to have few RMA failed acres. However, there are some counties with larger average differences. These counties occur next to Wisconsin, along the Illinois River, and in the southern part of Illinois. In these counties, failed acres have been larger.
Yearly differences can vary from the averages in Figure 1 for counties where FSA yields are lower than NASS yields. To Illustrate, take Wayne County Illinois with a -6.0 average difference. Differences by year in Wayne County are:
- 2009: FSA yield = 144 bu/acre, NASS yield = 153 bu/acre, difference = -9 bu/acre.
- 2010: FSA yield = 138 bu/acre, NASS yield = 139 bu/acre, difference = -1 bu/acre.
- 2011: FSA yield = 113 bu/acre, NASS yield = 122 bu/acre, difference = -9 bu/acre.
- 2012: FSA reports a t-yield of 85 bushels per acre, so a comparison could not be made.
- 2013: FSA yields = 144 bu/acre, NASS yield = 154 bu/acre, difference = -11 bu/acre.
- 2014: FSA yields = 185 bu/acre, NASS yield = 185 bu/acre, difference = 0 bu/acre.
Differences range from 0 bushels per acre to -11 bushels per acre. Because the difference is not stable, arriving at accurate estimates of ARC-CO payments will be problematic in counties where failed acres have a history of occurring. In many years, an eleven-bushel swing in yield can have a dramatic impact on ARC-CO payments. Some intuition of how many failed acres existed will aid in estimating the difference between FSA and NASS yields.
Commentary
Where NASS data exists, FSA yield is less than or equal to NASS yield. Since ARC-CO payments increase with lower yields, a conservative estimate of ARC-CO payments will be obtained using the yield per acre reported by NASS. There will be cases where this procedure underestimates ARC-CO payments.
The above explanation is useful in counties where NASS data is reported. Where NASS data does not exist, FSA uses different data and procedures to arrive at county yields. In these cases, estimating FSA county yields before there release will be difficult.
Disclaimer: We request all readers, electronic media and others follow our citation guidelines when re-posting articles from farmdoc daily. Guidelines are available here. The farmdoc daily website falls under University of Illinois copyright and intellectual property rights. For a detailed statement, please see the University of Illinois Copyright Information and Policies here.