


Farm Capital Investments
Increased farm earnings in the recent past have led to an increased level of capital purchases. No doubt the increase in the IRS Code Section 179 Expense Election to it’s 2011 level of $500,000 did it’s part to spur one thinking about a capital purchase to actually make that purchase. Equally, the advent of Bonus Depreciation at a 100% level played it’s part in enhancing the level of capital purchases.
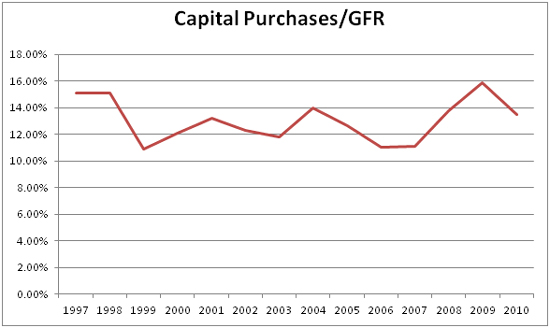
The chart below details a history of capital purchases per tillable acre over the period from 1997 to 2010. Capital purchases for this purpose are defined as machinery and land improvements purchased but not land itself. In 1997, there were 790 tillable acres per farm and gross farm returns were an average of $245,523. In 2010, average tillable acres had grown to 1,046 and gross farm returns had grown to $670,837. The conventional line of thought would be that good earnings and favorable tax code are great influences on capital purchases.

If we look at capital purchases relative to gross farm returns, we get a different point of view. For the fourteen year period, capital purchases as a percent of gross farm returns averaged just over 13% and there is not a great deal of variation from that average. The year 2009 was over 15%, but 1997 and 1998 were at high levels as well. Then, 1999 was one of the lowest at 10.89%, but 2006 and 2007 were low as well at 11.04% and 11.11%.
The obvious implication is that capital purchases are tied to revenue, but they seem to be tied in a direct and consistent way for the data at hand. This could also suggest a rate of economic depreciation that was sustained over a longer period.
Acknowledgments The data used in this work is from the local Farm Business Farm Management (FBFM) Associations across the State of Illinois. Without their cooperation, information as comprehensive and accurate as this would not be available for educational purposes. FBFM, which consists of 5,500 plus farmers and 60 professional field staff, is a not-for-profit organization available to all farm operators in Illinois. FBFM field staff provides on-farm counsel with computerized recordkeeping, farm financial management, business entity planning and income tax management. For more information, please contact the State FBFM Office located at the University of Illinois Department of Agricultural and Consumer Economics at 217-333-5511 or visit the FBFM website at www.fbfm.org .
Disclaimer: We request all readers, electronic media and others follow our citation guidelines when re-posting articles from farmdoc daily. Guidelines are available here. The farmdoc daily website falls under University of Illinois copyright and intellectual property rights. For a detailed statement, please see the University of Illinois Copyright Information and Policies here.