


Net Returns with ARC under Differing Price Scenarios
Agricultural Risk Coverage (ARC) is a revenue-based, proposed Farm Bill program passed by the Senate Agriculture Committee. In this post, net returns for corn are examined using prices and ARC payments detailed in a May 9, 2012 post here. At $4.00 per bushel and below corn prices, ARC will make payments, aiding in cushioning revenue losses. However, ARC payments are not large enough is assure profits, as farmers who cash rent will face losses at prices below $4.00 per bushel.
Net Return Calculations
Calculations of net returns are shown in Table 1. These calculations are for an average farm in Champaign County, Illinois for the years 2013 through 2016. Yields are assumed to be at their trend-line values of 180 bushels per acre in 2013, 182 bushels in 2014, 184 bushels in 2015, and 186 bushels in 2016. Net returns are calculated for four price scenario where the price in each year from 2013 through 2016 equals:
- $4.50 per bushel. This price represents an expected long-run average price for corn.
- $4.00 per bushel. This scenario represents a below average, but not unusual, price.
- $3.75 per bushel. This price is equivalent to prices during the late 1990s given a $4.50 per bushel long-run price. Prices during the late 1990s resulted in financial stress on farms.
- $3.55 per bushel. This price occurred in 2009. A string of years with prices below $3.50 per bushel are possible, but unlikely.
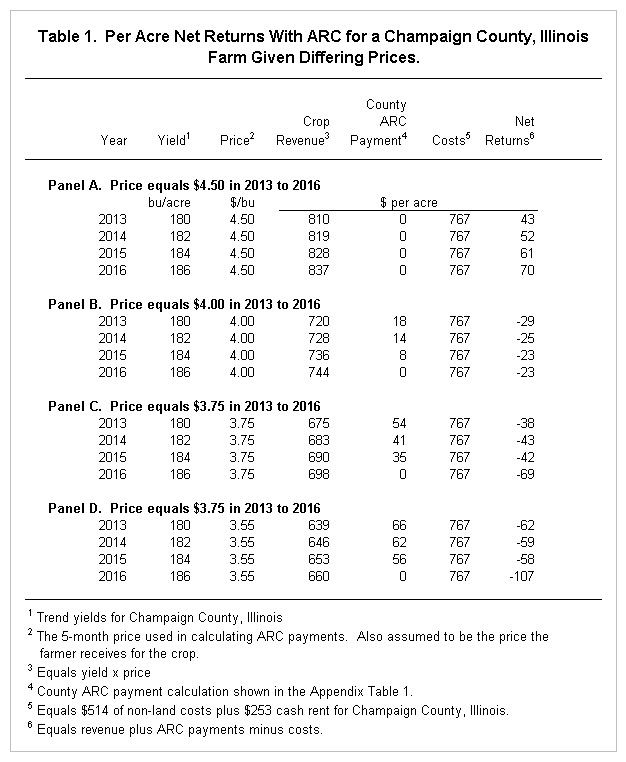
For each one of these price scenarios, crop revenues and ARC payments are calculated. Detail on the calculation of ARC payments is given in the Appendix Table 1, with more commentary provided in the May 9th post here. In these calculations, it is assumed that the price the farmer receives for corn and the price used to calculate ARC payments are the same.
Net returns equal crop revenue plus ARC payments minus costs. Costs total $767 per acre and are assumed to be the same across all years. Costs include:
- $514 per acre of non-land costs per acre. These represent direct, power, and overhead costs and are taken from March 2012 revenue and cost estimates for central Illinois high-productivity farmland here.
- $253 per acre of cash rent. This is based on a reported average cash rent of $233 for 2011 here. A $20 per acre increase was added to account for increases in cash rents in 2012. Given this cash rent, these net returns are representative of average cash rent situations. There are many cash rents above these averages.
Net Returns for a $4.50 per Bushel Corn Price
At a $4.50 price, ARC does not make payments (see Panel A of Table 1). A $4.50 price results in net returns of $43 per acre in 2013, $52 in 2014, $61 in 2015, and $70 in 2016 (see Panel A). All net returns are positive. These returns are close to those generated in the early to mid-2000s, when corn prices were much lower. Since 2006, costs have increased such that a $4.50 price would generate sufficient profits to assure that all obligations are met on most farms, but would not result in buildup of financial reserves.
Net Returns for a $4.00 per Bushel Corn Price
At a $4.00 corn price, ARC makes a payment of $18 per acre in 2013, $14 in 2014, and $8 in 2015 (see Panel B of Table 1). Net returns will be negative: -$29 per acre in 2013, -$25 in 2014, -$23 in 2015, and -$23 in 2016. ARC payments would cushion losses from lower prices; however, net returns would be negative.
Net Returns for a $3.75 per Bushel Corn Price
At a $3.75 corn price, ARC makes payments of $54 per acre in 2013, $41 in 2014, $35 in 2015, and $0 in 2016 (see Panel C of Table 1). These ARC payments reduce losses faced by farmers. For example, the net return of -$38 per acre in 2013 would be $54 lower, or -$92 per acre, if ARC payments are not made. With ARC payments, net returns are projected at -$38 per acre in 2013, -$43 in 2014, -$42 in 2015, and -$69 in 2016.
Net Returns for a $3.55 per Bushel Corn Price
At a $3.55 corn price, ARC makes payments of $83 per acre in 2012, $77 in 2014, $70 in 2015, and $0 in 2016 (see Panel D of Table 1). Net returns are -$454 per acre in 2013, -$44 in 2014, -$44 in 2015, and -$107 in 2016.
Commentary
In general, returns to corn and soybean farms have been above average in recent years because of relatively high corn prices. U.S.D.A. reports average national prices at $5.24 per bushel for the 2010 marketing year and projected $6.10 for the 2011 market year. Given recent increases in production and land costs, a $4.50 corn price will result in much lower returns than 2010 and 2011 prices. Prices below $4.00 will result in losses for corn production.
ARC will provide payments that cushion low revenues. ARC payments will not cover the entire decline in revenue because of the structure of the ARC program; hence, losses are possible with ARC. This occurs because ARC will not make payments until revenue has declined 11% from its benchmark revenue, then only a portion of the losses will be covered for the next 10 percent decline in revenue.
If a string of low prices over several years occurs, ARC will make larger payments in the beginning years. These payments then will decline through time. These payments will allow farmers to adjust to lower prices. Moreover, costs likely would adjust down to a lower price. For example, cash rents likely would decline in an extended period of low prices occur. Hence, ARC can be viewed as a transition program designed to aid farmers by cushioning revenue from market changes, ARC will not establish a permanent level of support around a specific price or revenue.
Appendices

Disclaimer: We request all readers, electronic media and others follow our citation guidelines when re-posting articles from farmdoc daily. Guidelines are available here. The farmdoc daily website falls under University of Illinois copyright and intellectual property rights. For a detailed statement, please see the University of Illinois Copyright Information and Policies here.