


Release of an Updated FAST Tool: Balance Sheet Program
The Balance Sheet program (avaiable here) has been updated to include two new features: 1) saving multiple users and years to a database and 2) preforming trend analysis. The tool allows users to calculate beginning and ending balance sheets, income statement, statement of cash flows, and a report of the user’s financial ratios, as well as deferred tax calculation. Users can generate financial statements for a one-year (simple balance sheet) or two-year period (beginning and ending year). The balance sheet program is a Microsoft Excel spreadsheet, part of our FAST series of tools.
Database Function
A previous post (available here) goes through most parts of the program.
This new release adds the ability for a user to save multiple years of data to a database in order to look at financial ratios over time. In addition, the database can be used to store data for multiple users.
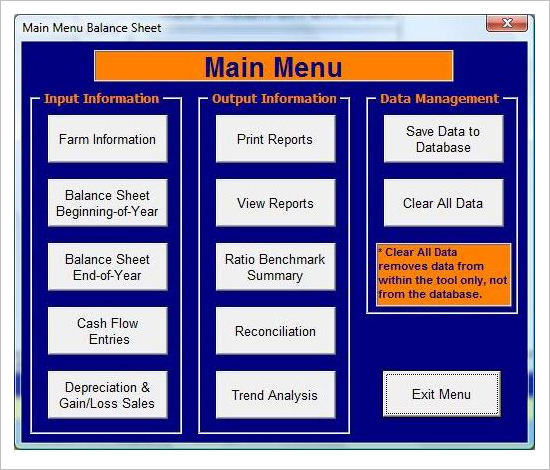
Most of the tool is identical to the previous version, except that now on the Main Menu, the user has additional Data Management options and a Trend Analysis button. Data Management options include saving data to the database and clearing the data from the program. The Trend Analysis button will load a sheet containing all of the ratio data from the database. The figure below shows the new menu layout.
Trend Analysis
The second new feature of the Balance Sheet program is the ability to perform trend analysis on the financial ratios. The way this works is once the farm information has been entered, all of the ratio data for the selected user that has been saved to the database is loaded into the program. This information will then be displayed in a table on the trend analysis sheet. On the trend analysis sheet, the user can also select an individual ratio and display a chart. The table and the chart will expand as additional years of data are added to the database. The figure below shows the trend analysis page.

Disclaimer: We request all readers, electronic media and others follow our citation guidelines when re-posting articles from farmdoc daily. Guidelines are available here. The farmdoc daily website falls under University of Illinois copyright and intellectual property rights. For a detailed statement, please see the University of Illinois Copyright Information and Policies here.