


How Long Should We Expect Corn and Soybean Prices to Remain Above or Below Average?
In a 2008 report and in subsequent articles we argued that corn, soybean, and wheat likely entered an era of higher prices beginning in late 2006. The “new era” of prices was associated mostly with the rapid expansion in biofuels production, particularly corn-based ethanol. Based on the level and pattern of average monthly prices received by Illinois producers in two previous price eras–January 1947 through December 1972 and January 1973 through November 2006–we projected three aspects of crop prices in the new era that began in December 2006. These were 1) average price, 2) the range in average monthly prices, and 3) the distribution of average monthly prices. An assessment of those projections was provided earlier this year here and here.
There is a fourth aspect of price patterns that is important, but not included in our previous analysis. That aspect is the persistence of prices at “high” or “low” levels. While the average level and range of prices over time is extremely important, those aspects exclude the potential for lengthy runs (streaks) of prices above or below the average price. Such runs have important risk management implications for corn and soybean producers. This aspect of prices seems to be especially relevant now since the prices of corn and soybeans have been above the average expected price in the new era for the past three years and corn prices have now moved below that expected average. A farmdoc daily post earlier this week by Gary Schnitkey showed that corn prices are also now close to breakeven levels, which provides further motivation for studying patterns of runs in corn and soybeans prices.
Here, we examine average monthly prices of corn and soybeans received by Illinois producers in the previous era from January 1973 through November 2006 for clues as to the number and pattern of consecutive months of prices above or below the average price that we can expect in the new era that began in late 2006. Of course, there is the usual caveat that history never repeats itself exactly the same way twice and there are significant differences in the market environment between the previous era and the unfolding new era. In particular, many aspects of federal commodity policy have changed, such as the acreage set-aside and grain reserve programs that were a staple of the previous era. These programs almost certainly kept prices from going even lower at times, while simultaneously lengthening runs of low prices as reserve stocks accumulated. Nonetheless, we argue that historical patterns in the previous era of January 1973-November 2006 provide useful guidance for expected price patterns in the new era and some insight to help manage the risk associated with those patterns.
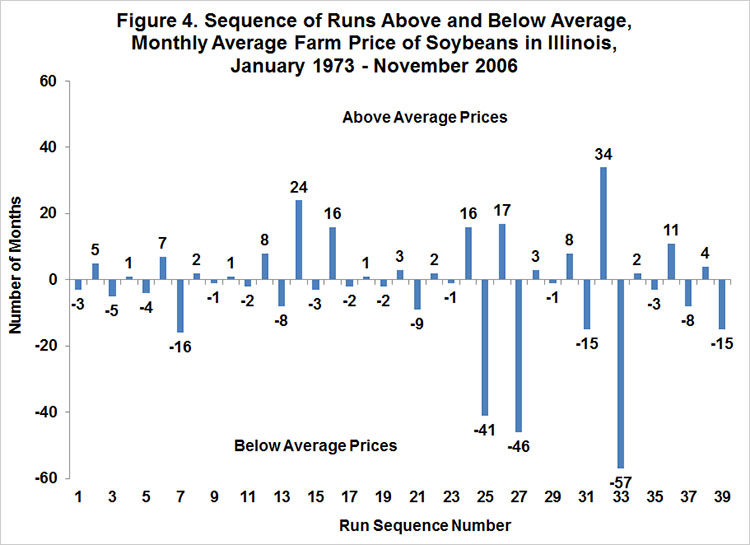
The pattern or price runs above and below average for corn and soybeans in the previous era is generally observable in Figures 1 and 2, respectively. The characteristics of the runs are more clearly summarized in Figures 3 and 4. The horizontal axis lists the sequence number for all of the runs of prices above or below average in the previous era for corn or soybeans. So, there were 38 separate runs of prices above and below average for corn and 39 for soybeans. Since the number of months in each run may vary, the height of each bar represents that number. Note also that a positive number indicates the number of months above average and a negative number indicates months below average. While the order of the sequence of runs is preserved in Figures 3 and 4, the actual dates for each run are not provided. These can be approximately determined by examining Figures 1 and 2. Please also note that the pattern of reversals between positive and negative runs in Figures 3 and 4 is by construction and has no predictive content. By definition, a positive run must be followed by a negative run, and vice versa.


Based on Figures 1-4, the following observations for the pattern of price sequences in the previous era can be made:
- Lengthy runs of monthly prices above and below the average price were not uncommon. For corn, there were 5 runs of prices above the average that spanned 14 months or more and 5 runs of prices below the average that spanned 16 months or more. For soybeans, there were 5 runs of prices above the average that spanned 16 months or more and 6 runs of prices below the average that spanned 15 months or more.
- Some of the runs, in either direction, were surprisingly long. For corn, there were 2 runs above and below average that spanned more than 30 months. The longest run for corn was 51 months below average (May 1998-July 2002). For soybeans, there was 1 run above average and 3 below average that spanned more than 30 months. The longest run for soybeans was 57 months below average (August 1998-April 2003).
- In general, there is little correlation between the length of the current run and those that follow shortly thereafter. In other words, a long run in either direction is not necessarily followed by a long-run in the opposite direction. Instead, runs that follow a long run tend to be a mix of positive and negative runs of varying lengths. This is precisely what one would expect from price series that behave approximately as a random walk.
- Since long runs above and below average are relatively rare, the period between both lengthy positive runs and between lengthy negative runs was also generally long for both crops, with one exception for soybeans. For corn, the time between positive runs that spanned 14 months or more ranged from 15 to 68 months. The time between negative runs that spanned 16 months or more ranged from 24 to 85 months. For soybeans, the time between positive runs that spanned 16 months or more ranged from 3 to 73 months. The time between negative runs that spanned 15 months or more ranged from 17 to 101 months.
The previous analysis of runs in the earlier era provides useful historical context when considering price patterns to date in the new era. While we do not know how long the new era of corn and soybean prices that started in December 2006 will last or what the actual average price will be during this still unfolding era, we do now have 82 months, or almost 7 years, of data that can be analyzed. In Figures 5 and 6 we show average monthly prices received during the December 2006 through September 2013 period (the latest month for which averages are available) along with two averages.


The higher average for both corn and soybeans is the actual average for the period while the lower average is the average we have forecast for the new era, however long it lasts. This period of 82 months has been characterized by extended periods above and below the average forecast price. Relative to the forecast average price, the average monthly price of corn starting in December 2006 showed the following chronological pattern:
- Below-15 months
- Above-7 months
- Below-25 months
- Above-35 months
The pattern for soybeans has been more diverse. Relative to the forecast average price, the average monthly price starting in December 2006 was as follows:
- Below-14 months
- Above-8 months
- Below-8 months
- Above-1 month
- Below-1 month
- Above-1 month
- Below-14 months
- Above-35 months
To date prices during the new era have demonstrated some of the same characteristics as in the previous era, particularly long runs of prices above and below the average. For corn, the October average price to be reported on November 27 is expected to be below the average, breaking the 35 month run of prices above average. Our analysis of price patterns for the previous era suggests that there could be an extended period before starting another long run of prices above the average. For soybeans, the average monthly price is expected to be above average in October and November, extending the run of above average prices. The current run exceeds the longest run of 34 months in the previous era and may eventually exceed the longest run of 37 months for corn. Like corn, once the current run ends history suggests that there could also be an extended period before starting another long run of prices above average.
Implications
Corn and soybean prices at the present time either have finished or are likely to finish what have been, by historical standards, very long runs above average. History suggests that it is quite unlikely that corn or soybean prices will soon experience another long run of above average prices. However, history also shows that it is unusual for a long run of above average prices to be followed by a long run of below average prices. The more likely outcome is a series of positive and negative runs of varying but shorter lengths.
Disclaimer: We request all readers, electronic media and others follow our citation guidelines when re-posting articles from farmdoc daily. Guidelines are available here. The farmdoc daily website falls under University of Illinois copyright and intellectual property rights. For a detailed statement, please see the University of Illinois Copyright Information and Policies here.