


Magnitude of Needed Decreases in 2016 Cash Rents
In last week’s farmdoc daily article (August 4, 2015), it was suggested that $100 per acre in costs cuts are needed to have small profits given 2016 prices of $4.00 per bushel for corn and $10.00 per bushel for soybeans. A good portion of these cuts likely will have to come from cash rents. In this article, the magnitude of decreases in cash rents are described.
Operator and Land Returns
Table 1 shows estimates of 2016 operator and land returns. These returns are split between the landowner and the farmer. If operator and land returns are $300 per acre and cash rent is $250 per acre, the farmers will have a $50 per acre net income. Operator and land returns are based on revenue, yields and costs shown in the 2016 Crop Budgets with 50% of the acres in corn and 50% acres in soybeans. Non-land costs in these budgets are roughly at the same level of 2015 costs. The calculation of operator and land returns from these budgets is illustrated in the August 4th farmdoc daily article.
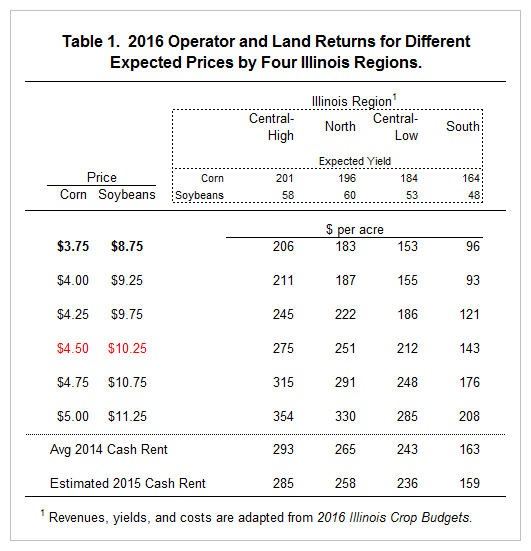
Operator and land returns are given for four regions: Central Illinois with high-productivity farmland (Central-High), Northern Illinois (North), Central Illinois with low productivity farmland (Central-Low) and Southern (South) Illinois. In Table 1, regions are ordered from the highest yielding on the left (Central-High) to the lowest yielding region on the right (South). Operator and land returns decrease with lower yields. Even though these are Illinois regions, returns shown in Table 1 are generalizable to a wider geographical area.
Table 1 also contains the 2014 average cash rent for each region. At this time, 2015 records are not summarized. The average 2015 rent is estimated based on statewide decreases in cash rents reported by the National Agricultural Statistical Service.
Returns and Rents at a $4.00 Corn and $9.25 Soybean Price
A corn price of $4.00 for corn and $9.25 for soybeans are relatively optimistic compared to current 2016 fall delivery bids. At these commodity prices, all operator and land returns are below the 2016 cash rents. For example, the central-high operator and land return is $211 and the 2014 rent is $285 per acre, giving a loss of -$74 per acre (see Table 1). Similar losses are estimated across all regions.
In last week’s article, $100 per acre of costs were suggested from a combination of non-land items and cash rents. It the entire $100 comes from cash rent, the central Illinois high-productivity average would be reduced from $285 per acre to $185 per acre, approximately the average cash rent in 2008.
Long-run Prices
As is always the case, price changes are possible, if not likely. Table 1 gives operator and land returns for differing price scenarios. At this point, having corn prices in the high $4.00 range seems improbable, but a number of factors could result in prices in that range.
A price scenario of particular interest is $4.50 corn and $10.25 soybean. Previous studies suggest that long-run prices will be near these values (farmdoc daily, February 27, 2013). Over the next five years, it seems reasonable to expect corn to average $4.50, although that is not the 2016 expectation based on prices of futures contracts. Even at these long-run prices, farmer returns would be negative at current average cash rents. Net income from a cash rent acre would be -$10 in central Illinois with high-productivity farmland ($275 operator and land return – $285 cash rent), -$7 in northern Illinois ($251 operator and land return – $258 cash rent), -$24 in central Illinois with low productivity farmland ($212 – $236) , and -$16 per acre in southern Illinois ($143 – $159). Even at long-run prices, farmers will face minimal to negative net incomes at current average cash rents.
It may seem hard to believe we would face negative returns at long-run prices of $4.50 corn and $10.25 soybeans. The reason this occurs is because the large increase in non-land costs (farmdoc daily, September 16, 2014). To illustrate, suppose that non-land costs were at 2006 level. In this case, operator and land return for central Illinois high-productivity farmland would be projected at $498 per acre for a $4.50 corn price and $10.50 soybean price. This $498 return is $223 higher than the $275 operator and land return shown in Table 1. Obviously, lower non-land costs change the need to reduce cash rents.
Summary and Recommendations
There is a need for farmers to cut costs, and this will lead to downward pressures being placed on cash rents. Cuts of $50 per acre likely are required from average cash rent levels, given decreases in non-land costs. More could be necessary if input costs do not decrease.
Note that needed cash rents reductions will vary as cash rents vary tremendously across farms in the same area with the same productivity. A range of $100 on either side of the average cash rent exists. Cash rents at the higher end will face more downward pressure than those at the lower end. Cash rents at the very low end may not need to be decreased.
Obviously, the need for cuts in cash rents will be reduced if expected 2016 crop prices increase. This suggests basing cash rents on revenue through a variable cash rent arrangement. More on variable cash rents will be discussed in next week’s farmdoc daily article.
References
Irwin, S., and D. Good. "The New Era of Crop Prices --- A Five-Year Review." farmdoc daily (3):38, Department of Agricultural and Consumer Economics, University of Illinois at Urbana-Champaign, February 27, 2013.
Schnitkey, G. "Crop Budgets, Illinois, 2016." Department of Agricultural and Consumer Economics, University of Illinois at Urbana-Champaign, July 2015.
Schnitkey, G. "Cost Cutting for 2016: Budgeting for $4 Corn and $9.25 Soybeans." farmdoc daily (5):141, Department of Agricultural and Consumer Economics, University of Illinois at Urbana-Champaign, August 4, 2015.
Schnitkey, G. "Will Non-Land Costs Decrease in 2015?" farmdoc daily (4):178, Department of Agricultural and Consumer Economics, University of Illinois at Urbana-Champaign, September 16, 2014.
Disclaimer: We request all readers, electronic media and others follow our citation guidelines when re-posting articles from farmdoc daily. Guidelines are available here. The farmdoc daily website falls under University of Illinois copyright and intellectual property rights. For a detailed statement, please see the University of Illinois Copyright Information and Policies here.