


Anhydrous Ammonia, Corn, and Natural Gas Prices Over Time
Nitrogen fertilizer is a major input in corn production and anhydrous ammonia is a widely used nitrogen fertilizer. In recent years, questions exist whether ammonia prices have decreased enough to reflect the decreases in corn and natural gas prices. Over time, anhydrous ammonia prices and corn prices are positively correlated. A major input in ammonia production is natural gas. As a result, natural gas prices also are positively correlated with anhydrous ammonia prices. From 2014 to 2016, anhydrous ammonia prices appear high relative to historical relationships between ammonia, corn, and natural gas prices.
Anhydrous Ammonia Prices Over Time
Figure 1 shows anhydrous ammonia prices for each year from 1960 to the present. These data are from the USDA and represent a national price in either March or April of the given year. Data from 1960 to 1969 were taken from Fertilizer Use and Price data available from Economic Reporting Service. From 1970 to 2014, data were obtained from Quick Stats, a data retrieval website containing data published by the National Agricultural Statistical Service (NASS). NASS has not published prices for 2015 or 2016. U.S. prices were estimated using Illinois prices published in the Illinois Production Cost Report, a publication of Agricultural Market Service. These Illinois prices were adjusted to reflect national prices based on historical relationships.
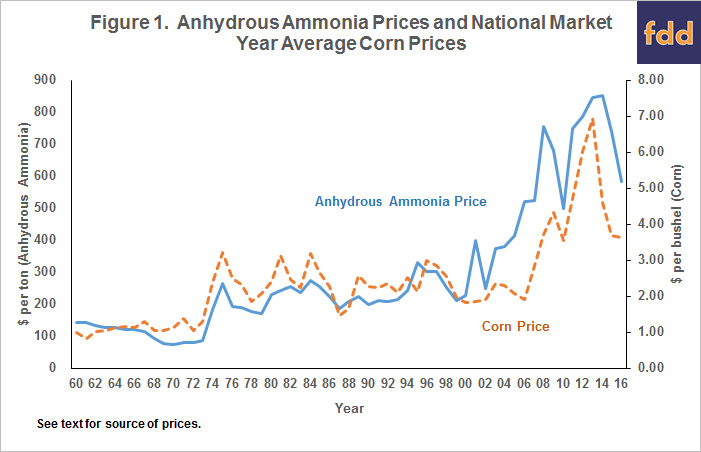
Three periods of ammonia prices appear in Figure 1. Between 1960 and 1973, ammonia prices did not trend up or down, varying around a $108 per ton average. In 1974, ammonia reached a higher level, averaging $230 per ton between 1974 and 2000. Similar to the 1960-73 period, ammonia price did not trend up or down in the 1974-2000 period. Between 2000 and 2008, ammonia prices rose in most years, increasing from $227 per ton in 2000 to $755 per ton in 2008. As will be shown below, these increases corresponded to a period of rising natural gas prices. Since 2008, ammonia prices have been choppy, reaching a low of $499 per ton in 2010 and a high of $851 per ton in 2014.
Corn Prices and Anhydrous Ammonia Prices Over Time
Figure 1 also shows U.S. corn prices. These corn prices are the average of monthly NASS price from September of the previous year to February of the current year. The 2016 price, for example, averages monthly prices from September 2015 to February 2016. These constructed prices are very similar to the Market Year Average (MYA) prices reported by NASS. The constructed price is based on prices during the first six months of the marketing year rather than the entire marketing year. These prices using the first six months were constructed so that the corn price was determined before the anhydrous ammonia price shown in Figure 1. From 1960 to 2015, the constructed price averaged $.05 per bushel less than the market year average price. The two price series had a .99 correlation coefficient.
There is a break in corn prices before and after 1973. Corn prices averaged $1.19 per bushel in the 1960-73 period. Because of increased export demands for U.S. grains, corn prices reached a new, higher plateau that existed from 1974 to 2006. During this period, corn prices averaged $2.33 per bushel. The 1973 break for corn occurred at the same time as that for anhydrous ammonia (see Figure 1). Since 2006, corn prices averaged higher than from 1973-2006. The 2006 increase in corn price occurred when corn began being used in ethanol production. The increase in corn prices occurred several years after the beginning of the 2000-2008 period of increasing anhydrous ammonia prices.
For the 1960-2016 period, the correlation coefficient between ammonia and corn prices was .86. Several rationales can be given for this high correlation. All commodity prices tend to be correlated as many of the same economic factors impact all commodities. Moreover, corn price serves as an indicator of demand for nitrogen fertilizer, with higher prices likely indicating more corn acres and the need for more nitrogen.
Anhydrous Ammonia and Natural Gas Prices Over Time
Natural gas represents a primary input and a major cost in the production of anhydrous ammonia. The Energy Information Agency (U.S. Department of Energy) publishes monthly natural gas prices. January and February gas prices paid by commercial users were averaged. Figure 2 shows these gas prices along with the same ammonia price series as in Figure 1. The Energy Information Agency only reports commercial gas prices back to 1984.

From 1984 to 2000, natural gas prices did not trend up or down, averaging $5.27 per thousand cubic feet. Then natural gas prices increased. From the 2000 price of $5.86 per thousand cubic feet, gas prices increased in most years, reaching a high of $13.56 per thousand cubic feet in 2006. During this period of rising natural gas prices, anhydrous ammonia prices also increased.
Since the 2006 high, natural gas prices have been on a downward trend, reaching low of $6.78 per thousand feet in 2016 (see Figure 2). Since 2006, natural gas prices decreased by 50%. This later period of price decreases occurred as new sources of natural gas became available due to fracking.
Before 2006 when natural gas prices when stable or rising, anhydrous ammonia and natural gas prices moved together closely. The correlation coefficient between natural gas and anhydrous ammonia prices was .92 for the 1984-2006 period. This tight relationship has not existed since 2008. To illustrate, the correlation coefficient from 1984 to 2016 was .67, down considerably from the .90 value for the 1984-2006 period.
Joint Impacts on Anhydrous Ammonia Prices
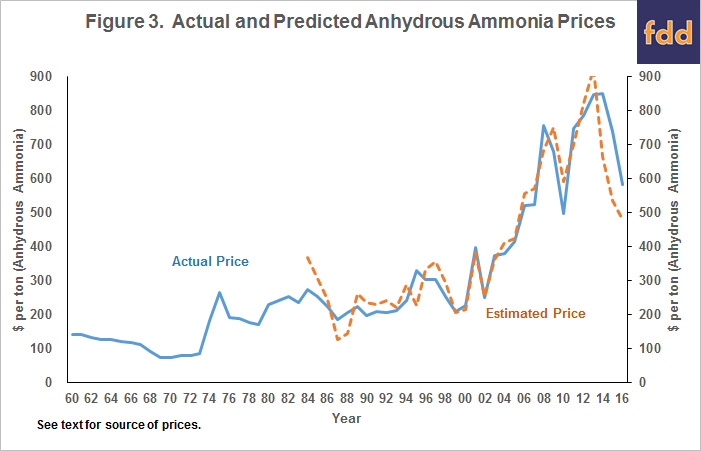
Both corn prices (demand factors) and natural gas price (supply and cost factors) have impacts on anhydrous ammonia prices. To jointly estimate these impacts, corn and natural gas prices were regressed on ammonia prices using ordinary least squares. The resulting equation is:
- Ammonia price ($ per ton) = -255.14 + 123.82 x corn price ($ per bushel) + 42.72 x natural gas price ($ per thousand cubic feet).
The regression equation has an adjusted r-square of .88, indicating that the regression equation explained a great deal of the variability in anhydrous ammonia prices.
Figure 3 shows actual anhydrous ammonia prices, as well as estimated prices from the above equation. From 1984 to 2013, actual and estimated ammonia prices follow each other, indicating that changes in anhydrous ammonia prices followed changes in corn and natural gas prices. Large divergences occurred in 2014, 2015, and 2016. In those years, the estimated prices were below actual prices. Estimated price was $185 per ton below the actual price in 2014, $203 per ton in 2015, and $103 per ton in 2016. Changes in corn and natural gas prices from 2014 through 2016 suggest lower anhydrous ammonia prices.
Commentary
Anhydrous ammonia prices are correlated with corn and natural gas prices. Increases in both corn and natural gas prices tend to lead to higher anhydrous ammonia prices. This relationship has become more strained in recent years. Given historical relationships, anhydrous ammonia prices should have decreased more than they did given the decreases in corn and natural gas prices in 2014, 2015, and 2016.
Two questions then arise. Why did anhydrous ammonia prices not decline more since 2014? Various arguments can be given. Perhaps there is a change in the regulatory environment leading to cost increases in anhydrous ammonia production. Prices of agricultural inputs may have a tendency to rise easier than they fall. Input prices take more time to adjust downwards.
A second related question is: Will anhydrous ammonia prices “catch up” to estimated prices by decreasing more in the coming year? This is an imperative question for farmers as they continue to look for ways to reduce costs, thereby arriving at a point where costs are lower than revenue. Time will tell whether ammonia prices continue to decrease into 2017. Farmers may wish to consider two items for 2017. First, a switch to more soybeans and less corn may be warranted. Soybeans do not use nitrogen fertilizer and have been more profitable than corn in recent years (farmdoc daily, February 16, 2016). One reason ammonia prices did not decrease as much in 2016 as projected may be because of the surprisingly large 2016 corn planting intentions. Moving acres out of corn will reduce demand for nitrogen fertilizers, putting downward pressure on ammonia prices. Second, farmers may need to continue to evaluate ways of reducing nitrogen fertilizer inputs.
References
ERS/USDA. Fertilizer Use and Price. Updated July 12, 2013, accessed June 14, 2016. http://www.ers.usda.gov/data-products/fertilizer-use-and-price
NASS/USDA. Quick Stats. https://quickstats.nass.usda.gov/
Schnitkey, G. "Corn versus Soybean Returns: 2016 Projections with Historical Comparisons." farmdoc daily (6):30, Department of Agricultural and Consumer Economics, University of Illinois at Urbana-Champaign, February 16, 2016.
USDA-IL Department of Ag Market News Service. Illinois Production Cost Report (Bi-weekly). https://www.ams.usda.gov/mnreports/gx_gr210.txt
Disclaimer: We request all readers, electronic media and others follow our citation guidelines when re-posting articles from farmdoc daily. Guidelines are available here. The farmdoc daily website falls under University of Illinois copyright and intellectual property rights. For a detailed statement, please see the University of Illinois Copyright Information and Policies here.