Revenue Protection (RP) Use on Corn in the Midwest
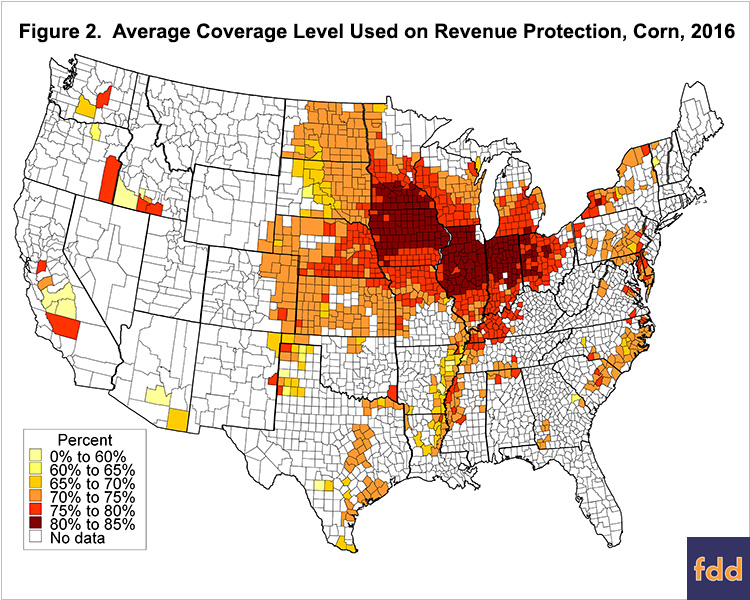
Revenue Protection (RP) is the most used crop insurance plan for corn. Over time, RP use has grown to over 90% of corn acres insured in many counties in the corn belt (farmdoc daily, December 13, 2016). As illustrated by maps in this article, farmers in the corn belt typically select 80 and 85% coverage levels when using RP. Detailed statistics on a county basis are available from the “product use” section of the 2017 Crop Insurance Decision Tool). Overall, use suggests farmers prefer revenue insurances that allow guarantees to increase if harvest prices are above projected prices. Use of high coverage levels suggests farmers value protection offered by crop insurance.
RP Use
According to 2016 Summary of Business statistics from the Risk Management Agency (RMA), RP use on corn acres is over 95% in most counties around the western corn-belt. For example, over 95% use predominates in North Dakota, South Dakota, Minnesota, Kansas, Iowa, and Missouri (see Figure 1).

Many counties in Illinois, Indiana, and Ohio have lower RP use than in the western corn-belt (see Figure 1). In these eastern corn-belt counties, higher use of Area Risk Protection (ARP) occurs. RP and ARP are similar in that both are revenue insurances whose guarantees increase if harvest prices are above the projected prices. ARP uses county yields in determining payments while RP uses farm yields. In eastern corn-belt counties, the sum of RP and ARP use often is above 90%.
Two counties illustrate RP and ARP use in the eastern corn-belt. Sangamon County is in west-central Illinois and has 66% of its corn acres insured using RP, 32% using ARP, with the sum of RP and ARP use being 98%. Noble County is in the northeast Indiana. In Noble County, RP use is 43%, ARP use is 51%, and the sum of RP and ARP use is 94%.
Some counties outside the corn belt have more use of Yield Protection (YP) insurance, a yield insurance. For example, higher YP use occurs along the Mississippi River in Mississippi, Arkansas, and Louisiana (see Figure 1). Take Bolivar County, Mississippi as an example. RP is used to insure 71% while YP is used on 29% of the acres. Besides the Mississippi Delta, more use of YP also occurs in:
- Counties in the middle part of Michigan,
- Western New York counties,
- Texas panhandle counties (see Figure 1).
By far, RP is the plan most used to insure corn. In some areas, predominately in the eastern corn belt, ARP has significant use, with RP and ARP being used on over 90% of corn acres. In areas outside the corn belt, RP use often is above 50% of acres, but YP has a higher percentage of acres than in the corn belt.
RP Coverage Levels
In most counties, RP’s coverage levels range from 50% to 85% coverage levels in 5% increment. Figure 2 shows a weighted average coverage level for RP products in 2016. To illustrate weighted average coverage level calculations, suppose a county has 60% RP acres insured using an 80% coverage level and 40% using an 85% coverage level. The weighted average coverage level for this county is 82% (.6 use x .80 coverage level + .4 use x .85 coverage level).

Average coverage levels for RP in corn is over 80% in southern Minnesota, the northern two-thirds of Iowa, Illinois, and Indiana, and western Ohio (see Figure 2). Counties around this core of the corn belt typically have average coverage levels between 75% and 80%. Average coverage levels then decrease to between 70% and 75% the further away from the central core of the corn belt.
County Level Detail
More detail on crop insurance use is available from the 2017 Crop Insurance Decision Tool, a Microsoft Excel spreadsheet available for download from farmdoc. In the “product use” section, users make a state, county, and crop selection. Then, product use details are given.
Figure 3 shows an example of output for corn in Sangamon County, Illinois. In 2016, 197,535 acres of corn were insured. Of the acres insured, 66.3% of acres insured using RP, 32.0% used ARP, and 1.0% used YP. RP with the harvest price exclusion (RPwHPE) and Area Yield Protection (AYP) had much smaller percentages of acres. Within RP use, 47.9% of acres were insured using an 85% coverage level, 14.7% at an 80% coverage level, and 3.7% at lower coverage levels.

Figure 3 shows these use statistics for 2016. Users can change the year to any year from 1995 onward. The product use section of the 2017 Crop Insurance Decision Tool also includes graphs detailing crop insurance use over time.
Commentary
RMA offers different types of insurances including yield insurances, revenue insurances with harvest price exclusion, and revenue insurances with guarantee increase provisions. RP and ARP are both revenue insurances with guarantee increase provisions. High use of RP and ARP suggest that farmers prefer revenue insurances over yield insurances. Moreover, high use suggests that farmers value the guarantee increase associated with RP and ARP.
In the heart of the corn-belt, farmers typically purchase RP at high coverage levels. Weighted average coverage levels are above 80% in the center of the corn-belt, indicating that most acres are insured using either the 80% and 85% coverage levels. High coverage levels suggest that farmers desire risk protection offered by crop insurance.
References
Schnitkey, G. "2017 Crop Insurance Premiums and 2016 Insurance Use in Illinois." farmdoc daily (6):232, Department of Agricultural and Consumer Economics, University of Illinois at Urbana-Champaign, December 13, 2016.
2017 Crop Insurance Decision Tool: Spring Planting Corn and Soybeans. farmdoc website, updated January 3, 2017. http://farmdoc.illinois.edu/pubs/FASTtool_special_cropins2017_Spring.asp
Disclaimer: We request all readers, electronic media and others follow our citation guidelines when re-posting articles from farmdoc daily. Guidelines are available here. The farmdoc daily website falls under University of Illinois copyright and intellectual property rights. For a detailed statement, please see the University of Illinois Copyright Information and Policies here.


