How Much More Do Capital Purchases on Grain Farms Need to be Reduced?
In a recent article, Illinois Farm Business Farm Management (FBFM) staff evaluated the impacts of machinery costs on Illinois grain farms, noting two important items (farmdoc daily, June 16, 2017). First, there is a strong link between lower machinery costs and higher farm profitability. Second, capital purchases have been coming down since 2013. On many farms, the necessity of meeting lower cash flows likely will require further reductions in capital purchases. However, additional reductions in capital purchases requires changing machinery complements held relative to complements on farms ten to fifteen years ago.
Capital Purchases on Illinois Farms
Capital purchases include investments in machinery, farm buildings, grain bins, drainage tile, and other longer-lived assets. On most grain farms, machinery purchases make up most of the capital purchases.
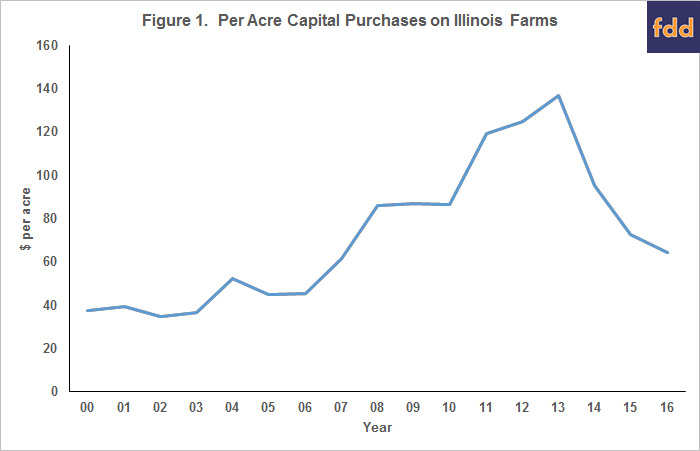
Between 2000 and 2006, capital purchases averaged $42 per tillable acre on farms enrolled in Illinois FBFM (see Figure 1). After 2006, capital purchases increased dramatically. Capital purchases were $62 per tillable acre in 2007, $85 per acre in the years from 2008 to 2010, $119 per acre in 2011, $124 per acre in 2012, and $137 per acre in 2013.

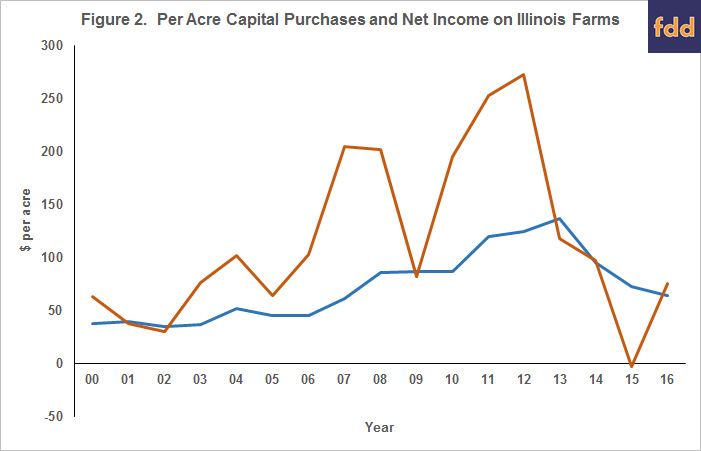
These increases in capital purchases corresponded to increasing net incomes caused by higher commodity prices. There is a positive correlation, though lagged, between net income and capital purchases, as is illustrated in Figure 2.

Farmers have economic motives for purchasing machinery during periods of higher incomes. High incomes provide additional cash flow. Making capital purchases is one way to reinvest the additional cash flow in the business. Also, tax policies such as section 179 expensing and fast depreciation schedules allow much of the current year’s capital purchases to offset higher taxable incomes, thereby reducing income tax payments during high-income years.
Since 2013, capital purchases have fallen dramatically. From the $137 per acre high in 2013, capital purchases were $96 per acre in 2014, $73 per acre in 2015, and $64 per acre in 2016. These declines in capital purchases correspond to net income decreases (see Figure 2).
Is $64 Per Tillable Acre Low Enough?
Now the following question exists: Is the average $64 per acre of capital purchases in 2016 low enough or does it need to decline more in future years? On the side of further reductions is the high levels of capital expenditures from 2011 to 2013. These higher levels likely built asset bases above those needed for normal operations. If a “draw down” period occurs, the question still is what is the long-run, sustainable level of capital purchases on farms.
A starting point for evaluating the longer-run level of capital purchases is to note that there was a six-year period during the early 2000s when capital purchases averaged $42 per acre. Current expectations of net income are not that different from incomes experienced during the 2000-2006 period. Given similar incomes, the $42 per acre benchmark is a good starting point for determining a longer-run capital purchase for 2017 and beyond.
However, the new level of sustainable capital purchases likely is above $42 per acre because machinery prices have increased. For example, a 255 horsepower tractor in 2006 had a list price of $216,000. A similar tractor in 2017 has a list price of $340,000. The increase in the tractor list price was an average of 4% per year over the eleven-year period from 2006 to 2017. Similarly, the list price of a combine capable of handling an 8-row corn head was $241,000 in 2006. The list price of a similar combine in 2017 is $398,000. The increase in the combine’s list price was 5% on a yearly basis. In the intervening years, technological change causes the 2017 machines to be better than the 2006 machines. Still, farmers must still cover the additional costs of the new machines.
Capital purchases averaged $42 per acre from 2000 to 2006. Given a 4% yearly increase in machinery prices, a $42 per acre purchase in 2006 would equal to a $63 per acre purchase in 2017 (i.e., a yearly increase of 4% causes the 2006 level to be $63 per acre in 2017). This suggests that $63 per acre in 2016 would purchase roughly the same machinery level as a $42 per acre purchase in 2006. This $63 equivalence level is very close to the average $64 per acre level of capital purchases in 2016.
In my opinion, the necessity of matching lower revenue with expenditures will require farms to further reduce capital purchases from the $66 per acre average level in 2016. Setting a goal for the low to mid $50 per tillable acre seems reasonable. Given machinery price increases, lower capital purchases mean holding a different machinery complement in 2016 as compared to that in 2006. Lowering capital expenditures can occur through a combination of using the same machinery complement over more acres and reducing the amount of machines. Machine reduction could occur through less tillage.
Importance of Machinery-Related Decisions and Strategies
Decisions related to capital purchases have large impacts on a farm’s profitability. In a farmdoc daily article on June 16, 2017, FBFM staff show that profitability increases as machinery-related costs decrease. This finding is the standard. In a similar study, for example, machinery costs were lower by $18 per acre on the farms with the highest one-third of returns compared to the average return levels (farmdoc daily, June 6, 2017).
Strategies for lowering machine costs are not new and likely revolve around:
- Properly matching equipment to the farm size,
- Having as low of a machinery inventory given a farm size as possible,
- Spreading machinery investment over more acres through farming more acres, custom farming some acres, or sharing equipment across farms, and
- Having proper replacement strategies.
Implementing any of the above strategies is not easy.
Perhaps an area to evaluate is tillage. Reducing tillage will lower the need for tillage equipment and could reduce horsepower requirements of tractors. Eliminating tillage equipment and larger-sized tractors will reduce machinery investment and costs. If yields do not decrease with less tillage, the strategy results in higher farm profitability.
Summary
Overall, farmers have reduced capital purchases in recent years. More reductions likely are needed. Because of increases in machinery prices, further reductions in capital purchases will require changing machinery complements. Those changes likely will result a different machinery complements to that held during the 2000-2006 period, the period before higher incomes experienced from 2006 to 2012.
References
Krapf, B., D. Raab, and B. Zwilling. "What is the Impact of Power and Equipment Costs on Illinois Grain Farms?" farmdoc daily (7):112, Department of Agricultural and Consumer Economics, University of Illinois at Urbana-Champaign, June 16, 2017.
Schnitkey, G., N. Paulson, and D. Lattz. "Differences in Revenue and Costs for Higher and Average Return Grain Farms." farmdoc daily (7):104, Department of Agricultural and Consumer Economics, University of Illinois at Urbana-Champaign, June 6, 2017.
Disclaimer: We request all readers, electronic media and others follow our citation guidelines when re-posting articles from farmdoc daily. Guidelines are available here. The farmdoc daily website falls under University of Illinois copyright and intellectual property rights. For a detailed statement, please see the University of Illinois Copyright Information and Policies here.


