Illinois Farmland Rents: 2017 State Values and 2018 Outlook
The National Agricultural Statistical Service (NASS), an agency of the U.S. Department of Agriculture, released 2017 cash rents and land values for major agricultural producing states. For Illinois, the 2017 cash rent was $218 per acre, down by $3 per acre from the 2016 level. This decrease in cash returns have been relatively modest, particularly given the levels of farmland returns. If corn prices continue to remain below $4.00 per bushel, cash rents would have to decline by about $60 per acre for farmers to have the same average return level as from 2000 to 2005. Cash rent declines of that size are not likely in 2018; however, downward pressures of cash rents will continue.
Historic Illinois Cash Rents
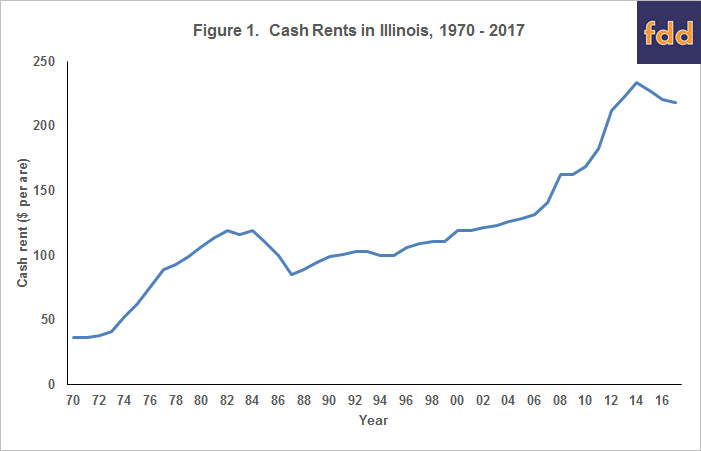
Cash rents were on an increasing trend from 1987 until 2014, averaging an increase of 3.6 percent per year (see Figure 1). Faster growth occurred from 2006 to 2014 when cash rent increased an average of 7.4 percent per year. The period from 2006 to 2014 period was characterized by strong corn and soybean prices caused by increased use of corn in producing ethanol, growing export demand for soybeans, and several years of yield issues in major grain producing areas. These strong prices then led to high returns, precipitating the rise in cash rents.
Commodity prices have declined from highs occurring between 2006 and 2013, leading to lower agricultural returns. As a result, cash rents have declined modestly. The highest average cash rent in Illinois occurred in 2014 and was $234 per acre (see Figure 1). Cash rents declined to $228 per acre in 2015, $221 per acre in 2016, and $218 per acre in 2017. From 2014 to 2017, cash rents declined by $16 per acre, or 6.8 percent. The 2017 cash rent is roughly the same as the average cash rent in 2012.

Cash Rents and Returns
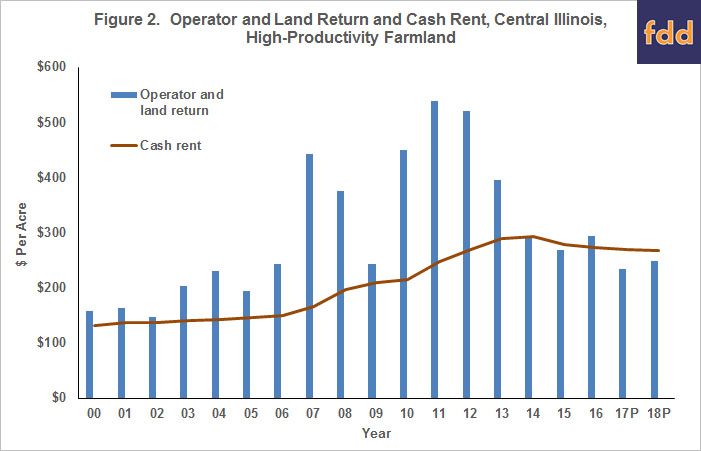
The relationship between returns and cash rents for high-productivity farmland in central Illinois is shown in Figure 2. Overall, central Illinois will have higher returns and rents as compared to the entire state, but trends are the same for both. In Figure 2, bars show operator and land returns while the line gives average cash rents. Operator and land returns equal gross revenue minus non-land costs averaged over corn and soybeans. This return is the amount that is left to split between farmer and land owner. Cash rent is the return going to the landowner. The farmer than receives returns equal to operator and land return minus cash rents.

In 2016, operator and land returns in central Illinois averaged $294 per acre. The average cash rent was $273 per acre leaving the farmer a return of $21 per acre ($21 = $294 operator and land return – $273 cash rent).
Between 2000 and 2005, operator and land return were above cash rent by an average of $43 per acre. These years were not exceptionally good income years in agriculture, practically the years between 2000 and 2002.
Operator and land returns exceeded cash rents by sizable amounts from 2006 through 2013 due to high commodity prices. From 2006 to 2013, central Illinois farmers received an average of $4.41 per bushel for corn and $11.21 per bushel for soybeans. Because of high returns, cash rents rose from 2006 to 2013.
From 2014 onward, corn prices have averaged below $4.00 per bushel. From 2015 onward, soybean prices have averaged below $10.00 per bushel. These lower prices caused lower operator and land returns. In 2014 and 2015, operator and land returns were below cash rents, leading to downward pressures on cash rents (see Figure 2). In 2016, operator and land return was above cash rent. This positive margin did not occur because of higher prices. Rather, exceptional yields and Agricultural Risk Coverage (ARC) payments caused operator and land returns to exceed cash rents.
For 2017 and 2018, operator and land returns are projected to be lower than average cash rents (see Revenues and Costs for Corn, Soybeans, Wheat, and Double-Crop Soybeans for more detail on projections). These projections have yields at trend levels, corn prices below $4.00 per bushel, and soybean prices below $10.00 per bushel. These levels of corn and soybean prices will not generate returns above cash rents unless yields are well above average. Of course, the 2017 and 2018 projections could change. Both yields and prices could be higher than are currently anticipated.
The 2017 projections use a corn price of $3.80 per bushel and a soybean price of $9.70 per bushel. For the 2017 projected operator and land return to be $43 per acre above cash rent, the cash rent would have to be $206 per acre. A $206 cash rent is $64 lower than the $270 cash rent for 2017. Basically, cash rents would have to decrease back to levels of cash rents in 2008 and 2009.
At the state level, the average cash rent was $218 per acre in 2016. Similar to central Illinois, cash rent in the entire state would have to have a decline of $64 per acre to have comparable returns to 2000 to 2005. This would lead to cash rents of $154 per acre, roughly the same as in 2008 and 2009.
Why Have Cash Rents Not Declined More?
Given lower returns, a suitable question is why have cash rents not declined more in recent years? In my estimation, there are three reasons why cash rents have not declined more.
First, the high returns from 2006 through 2013 led to high incomes and farmers increased the liquidity, solvency, and net worth positions of their farms (see farmdoc daily, October 4, 2016). Working capital increases during 2006 to 2013 have allowed farmers to pay higher cash rents since 2013. The higher returns during 2006 through 2013 also fostered attitudes in “catching up” between some farmers and land owners. Many land owners did not receive as high as possible cash rents prior to 2013, causing farmers to not lower cash rents as much as farmland returns have been lowered since 2013.
Second, many expect that commodity prices will increase. For example, corn prices above $4.00 per bushel would cause much less of a need to cut costs and there are good reasons to believe that prices will return to higher levels. However, prices continue to be below $4.00 from 2013 to the present, a period of five years. Possibilities of higher prices remain but have not occurred yet.
Third, lowering cash rents is very difficult from a farmer perspective due to the competition to rent farmland. Lowering cash rents increase the probability of losing farmland to other farmers. Prospects of any future returns are given up when a farmer loses farmland. From a landowner perspective, lower cash rents mean lowering a return from an asset, which is also always difficult.
Outlook for Cash Rents in 2018
More downward pressure could be felt in setting 2018 cash rents than during the period when 2017 cash rents were set. At this point, yields look to be lower in 2017 than they were in 2016. Northern Illinois appears to have been too wet and much of central and southern Illinois was too dry. As of yet, there has not been an upward price response to lower yields. Higher prices could counter lower yields. ARC and crop insurance payments are possible, but these payments will not lead to profitability in most cases, instead reducing very low returns. Lower yields and similar prices suggest that 2017 incomes will be lower than 2016 incomes. Lower incomes would then lead to declines in working capital. As working capital decreases, the ability to pay higher cash rent decreases.
In my opinion, a key will be price response this fall. If prices do not increase from current levels, farmers may question the likelihood of higher prices in the near future. Having little price response would be particularly dampening to farmer future expectations if yields are below trend. Building budgets with longer-term prices below $4.00 for corn and $10.00 for soybeans could lead farmers to question the advisability of paying current cash rent levels.
Summary
As has been the case in the last several years, pressures will be to reduce cash rents in 2018. Over time, those pressures will intensify as the financial position of farms erode and commodity prices remain relatively low. Pressures will remain on cash rents as long as corn prices remain below $4.00 per bushel and soybean prices remain below $10.00 per bushel.
The above presumes that yields will be at or below trend levels in 2017 and that commodity prices do not increase. Commodity prices above $4.00 per bushel on corn and above $10.00 per bushel on soybeans would ease pressures for lower cash rents and farmland prices. Perhaps there will be commodity price increases as 2017 yields come into clearer focus.
References
Schnitkey, G. "Financial Performance of Illinois Grain Farms: Deterioration in 2015." farmdoc daily (6):187, Department of Agricultural and Consumer Economics, University of Illinois at Urbana-Champaign, October 4, 2016.
Schnitkey, G. "Revenue and Costs for Corn, Soybeans, Wheat, and Double-Crop Soybeans, Actual for 2011 through 2016, Projected 2017 and 2018." Department of Agricultural and Consumer Economics, University of Illinois at Urbana-Champaign, July 2017.
Disclaimer: We request all readers, electronic media and others follow our citation guidelines when re-posting articles from farmdoc daily. Guidelines are available here. The farmdoc daily website falls under University of Illinois copyright and intellectual property rights. For a detailed statement, please see the University of Illinois Copyright Information and Policies here.


