Financial Performance of Illinois Grain Farms: Deterioration in 2015
Financial performance on Illinois grain farms deteriorated in 2015 compared to performance in 2006 through 2012. From 2006 through 2012, Illinois grain farms were profitable and increased financial strength. Since 2013, both profitability and liquidity decreased. In 2015, net incomes were very low, liquidity decreased, and debt increased relative to assets.
Financial Snapshot
Table 1 shows measures of financial performance for Illinois grain farms enrolled in Illinois Farm Business Farm Management (FBFM). These measures come from a broader set available from the Financial Benchmark Tool on farmdoc.

Measures in Table 1 are averages. As a result, Table 1 masks variability across grain farms. Some farms had worse performance while other farms had better financial performance than depicted in Table 1.
Select measures are taken from important categories measuring performance: efficiency, profitability, repayment capacity, liquidity, and solvency. Each category is described in the following sub-sections.
Efficiency
Table 1 contains three efficiency measures, all of which that state expenses as a percent of value of farm production. For grain farms with no livestock, value of farm production equals gross revenue. Increasing levels of these ratios indicate decreasing efficiency, leading to lower profitability.
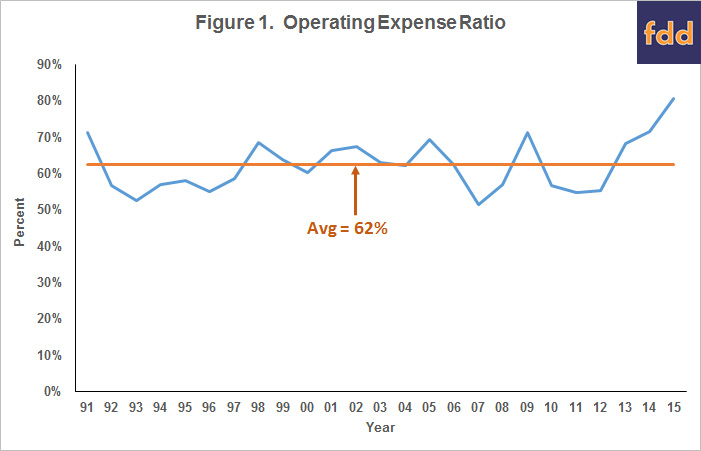
The operating expense ratio includes fertilizer, seed, chemicals, drying, storage, machinery related cost other than depreciation, overhead, and rents. From 1991 through 2016, the operating expense ratio averaged 62% (see Figure 1). From 2010 to 2012, the operating expense ratio was well below the 1991-2016 average: 57% in 2010, 55% in 2011, and 55% in 2012. Then the operating expense ratio rose dramatically to 68% in 2013, 71% in 2014, finally reaching 81% in 2015. The 2015 ratio was the highest of the 1991-2016 period, 19 percentage points higher than the 1991-2016 average.

Two factors led to the high operating expense ratio in 2015. Costs increased from 2006 to 2013, leading to higher expense ratios. Since 2013, corn and soybean prices have decreased, resulting in lower gross revenues and higher expense ratios.
The depreciation expense ratio increased from 7% between 2009 and 2012 to 10% in 2012, 11% in 2014, and 13% in 2015 (see Table 1). This increase is attributed to higher depreciation levels and reductions in gross revenue.
Interest expense ratio were in the 2 to 3% ranges from 2009 to 2015. Low debt levels and low interest rates cause interest expense to be small relative to other expenses.
Overall, operating and depreciation expense ratios have increased in recent years, with historically high levels occurring in 2015. As illustrated in the next sub-section, higher expenses ratios lead to lower profitability.
Profitability
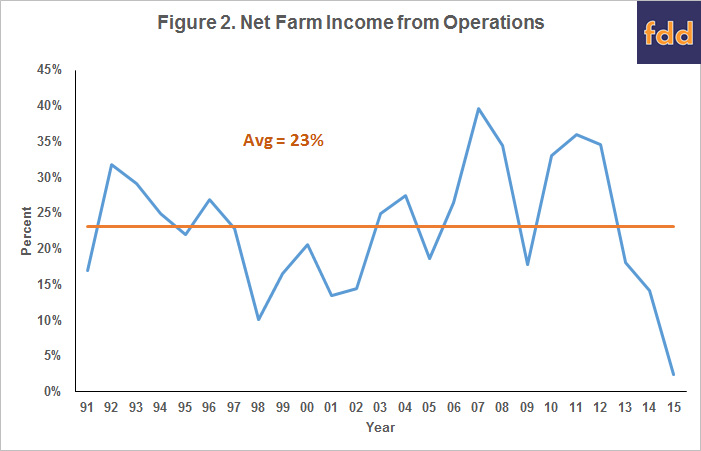
In Table 1, Profitability is measured by net farm income from operations and return on farm assets. Net income from operations equals net income divided by value of farm production. Net income from operations averaged 23% from 1991 through 2015 (see Figure 2). From 2010 to 2013 net income from operations was above the 1991-2015 average: 33% in 2010, 36% in 2011, and 35% in 2012. Net incomes have been below the 1991-2015 average since 2013: 18% in 2013, 14% in 2014, and 3% in 2015.

The 3% net income from operations in 2015 was the lowest of the 1991-2015 period. A useful comparison is to the years from 1998 to 2002, another period of low income. From 1998 through 2002, commodity prices were low and much of grain farm revenue came from government programs. Net income from operations was 10% in 1998, 17% in 1999, 21% in 2000, 14% in 2001, and 14% in 2002. From a profitability standpoint, 2015 was worse than any year in the 1998-2002 period.
Return on farm assets follow the same time cycles as net income from operations (see Table 1). Return to assets was negative in 2015, the first negative average value from 1991-2015.
Repayment Capacity
The term debt and capital lease ratio – hereafter referred to as the term debt ratio – measures a farm’s ability to repay debt from cash flow generated by farm and non-farm sources. The term debt ratio equals cash available from operations divided by scheduled principal and lease payments. Cash available from operations includes farm cash income from farm and non-farm sources less living withdrawals.
Term debt ratios above 1.0 indicate that their cash from operations is greater than that needed to cover debt payments. Below 1.0 means that operations did not generate sufficient funds to cover scheduled debt payments. Note that the term debt ratio was .44 in 2015, well below 1.0 (see Table 1). In 2015, most grain farms did not generate enough funds to cover debt payments. Low financial efficiency led to this repayment capacity issue.
Working Capital
Working capital is liquid financial reserves available to the operation. Working capital provides a buffer when an operation generates a cash shortfall. The working capital measure used in Table 1 is the current ratio. The current ratio equals current assets divided by current liabilities (see farmdoc daily, September 20, 2016) for a discussion of working capital). The current ratio decreased in recent years. From 1991 to 2015 period, the current ratio reached a high of 3.08 in 2012. Since 2012, the ratio declined: 2.59 in 2013, 2.32 in 2014, and 2.05 in 2015.
In recent years, grain farms have been generating insufficient cash from operations to meet all needs. As a result, working capital buffers built from 2006 to 2012 are decreasing. After this year, these built up buffers will be gone on many farms (see farmdoc daily, September 20, 2016).
Solvency
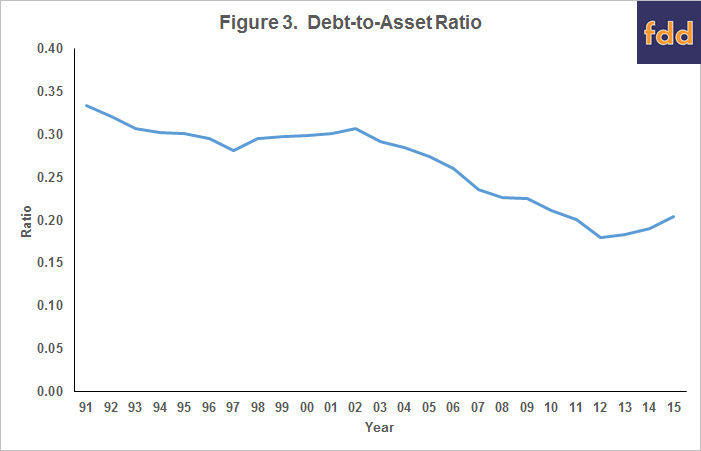
Solvency measures the amount of debt relative to assets. In Table 1, solvency is measured by the debt-to-asset ratio. Higher ratios mean that debt is a higher proportion of assets. Decreasing debt-to-asset ratio indicated increasing solvency, and vice versa.
From 1991 to 2013, debt-to-asset ratios decreased from .33 in 1991 to .18 in 2013 (see Figure 3). Since 2013, debt-to-asset ratio increased: .19 in 2014 and .20 in 2015.

Most farms have a strong solvency position. However, the general trend of decreasing debt-to-asset ratios has stopped and reversed. Farms are beginning to incur debt as a result of operating shortfalls.
Summary
Because of high operating expenses relative to revenues, average net farm incomes in 2015 were lower than any other year since 1991. In 2015, most farms did not generate enough income to cover all obligations. Most farms weathered the low 2015 incomes by drawing down working capital. Because sufficient working capital reserves existed, few farms faced much financial difficulty. However, decreases in working capital likely will continue. By the end of 2016, working capital reserves built from 2006 to 2012 will be reduced to equivalent levels before the 2006-2012 buildup (farmdoc daily, September 20, 2016).
If net incomes do not improve, the next step will be to use financial reserves other than working capital to cover losses. Most farms have relatively high equity and plenty of solvency. As a result, liquidity shortages can be remedied in the short-run by restructuring outstanding operating loan balances as longer-termed structured debt. This strategy will provide breathing room but presents its own problems (farmdoc daily, August 30, 2016). Simply restructuring debt does not address the underlying cause of the problem: expenses are too high relative to revenue. Moreover, many lenders may be uncomfortable with the strategy of restructuring debt. Even after restructuring, the farm may not have sufficient cash flow to cover all obligations unless more cost and rent cuts occur. Financial regulations instituted since the 2008 housing crisis may cause lenders to require that a farm projects positive repayment capacity before 2017 before loans are made.
Income in 2016 likely will improve over 2015 levels due to high yields (see farmdoc daily, September 27, 2016). However, many farms still will be not generating positive cash flows. Due to low projected prices, 2017 could be a very low income year. All of this leads to a difficult planning season. Given current price projections, it will be difficult for farms to project positive cash flows for 2017. As a result, farmers will continue to be under pressures to cut non-land costs and cash rents. Lenders will be under pressures to maintain the credit quality of their farm borrowers.
References
Schnitkey, G. "2017 Crop Budgets, 2016 Crop Returns, and 2016 Incomes." farmdoc daily (6):183, Department of Agricultural and Consumer Economics, University of Illinois at Urbana-Champaign, September 27, 2016.
Schnitkey, G. "Working Capital Buffers Gone at End of 2016." farmdoc daily (6):178, Department of Agricultural and Consumer Economics, University of Illinois at Urbana-Champaign, September 20, 2016.
Schnitkey, G. "The Danger of Refinancing." farmdoc daily (6):164, Department of Agricultural and Consumer Economics, University of Illinois at Urbana-Champaign, August 30, 2016.
Disclaimer: We request all readers, electronic media and others follow our citation guidelines when re-posting articles from farmdoc daily. Guidelines are available here. The farmdoc daily website falls under University of Illinois copyright and intellectual property rights. For a detailed statement, please see the University of Illinois Copyright Information and Policies here.


