Reviewing the State of the Farm Bill: Perspective from Spending
Looking ahead to potential farm bill reauthorization this year also presents opportunities to review the 2014 Farm Bill. One of the key issues surrounding the last farm bill was the Congressional focus on reducing Federal spending. As such, this article compares updated reports and estimates of spending (outlays) compared to what was expected from the bill when Congress passed it. The comparisons are based on the Congressional Budget Office, using their forecasts and projections (CBO).
Background
Table 1 compares CBO forecasted outlays from 2014 with the updated outlays (both actual and revised projections) from the 2017 CBO Baseline (CBO Baseline Projections for Selected Programs). When Congress passed the Agricultural Act of 2014, CBO estimated that the bill would spend $956 billion over the 2014-2023 budget window and would lower spending from the May 2013 Baseline by $16.6 billion over 10 years (CBO Cost Estimate, Jan. 27, 2014; CBO Baseline, May 2013). Included in that projection, CBO scored the bill at $488.6 billion during its expected life (2014 through 2018) and Table 1 limits the comparison to those years.
It is important to note that commodity program payments are subject to a timing shift such that the payments for the 2014 crop year are made in Fiscal year 2016 and so forth; the figures in Table 1 are adjusted accordingly such that Year 1 for commodity payments is Fiscal Year 2016 (see, farmdoc daily, November 22, 2016). One aspect of this timing shift is that it will push some of the spending outside of the budget windows in the CBO scorekeeping process; the spending presented in Table 1 pulls it back into the five-year farm bill window. For the remainder of the programs, fiscal years match Years 1 through 5 and fiscal years 2014 through 2016 (years 1 through 3) consist of the actual outlays reported by CBO. Fiscal years 2017 and 2018 (years 4 and 5) are the updated projections from the June 2017 Baseline.

Even with the timing shift adjusted in the outlays, the 2014 Farm Bill has contributed more to deficit reduction than originally projected by CBO. Combined, the four main titles with mandatory spending (commodities, conservation, nutrition and crop insurance) are now expected to spend over $25 billion less than what CBO expected when the bill passed in 2014.
Spending on Conservation Programs
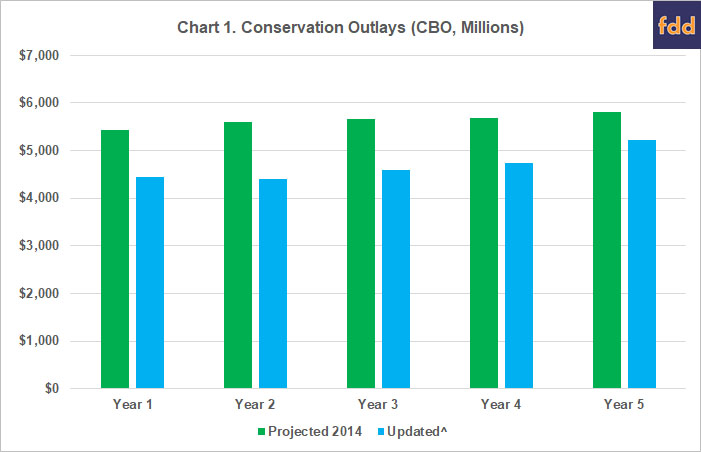
One area of increased reductions in outlays has been the conservation programs in Title II. CBO’s latest report indicates that conservation reductions are on track to roughly double what was expected in 2014. The bill scored nearly $4 billion in savings for 10 years from conservation, but the updated baseline indicates that the programs in operation are on track to save $8.8 billion over 10, or $4.8 billion more than expected. Chart 1 compares the 2014 projections with the updated CBO outlays for conservation for the five-year expected life of the farm bill. The additional savings likely come from efforts by appropriators to reduce program authority for use to cover appropriation demands; a matter to be explored further in the future.

Spending on Food Assistance in SNAP
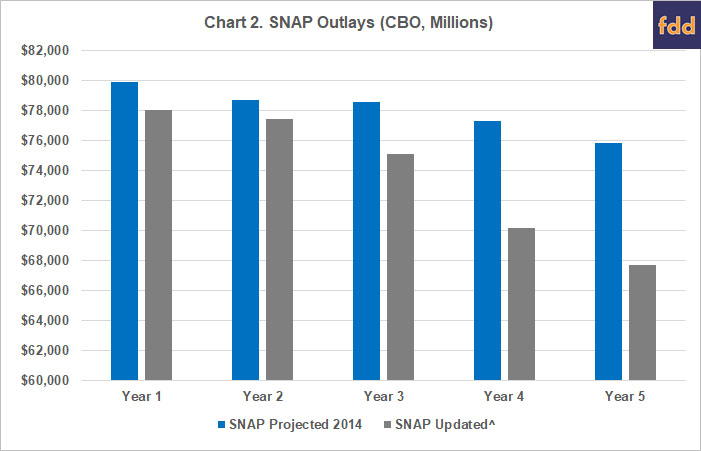
As is clear from Table 1, the bulk of the actual and expected savings are due to reduced outlays from the Supplemental Nutrition Assistance Program (SNAP) in the nutrition title. Chart 2 compares the CBO forecast for SNAP from 2014 with the June 2017 CBO Baseline, illustrating the lower spending for the program during the life of the 2014 Farm Bill (2014-2018).

SNAP provides assistance to low-income individuals and families. Participation in the program and outlays are therefore responsive to changes in the economy. Chart 3 provides further information for SNAP outlays by comparing the projections for the unemployment rate and SNAP participation. The updated information comes from CBO’s June 2017 Baseline and the projections are what was estimated by CBO in the May 2013 Baseline used to score the 2014 Farm Bill.

Combined, the two charts illustrate that falling unemployment rates have an impact on lowering participation in SNAP. Both have fallen more than anticipated in 2014, resulting in the substantially lower outlays from the SNAP program than had been expected. Participation is now expected to fall from nearly 47 million in 2014 to under 41 million by 2018, tracking about a million fewer participants each year than had originally been expected. Additionally, the unemployment rate has fallen faster than expected, tracking roughly a percentage point lower than the forecast. The unemployment rate alone does not determine participation because people can be employed but with incomes that remain low enough to continue to qualify them for SNAP. One example, a recent USDA report indicated that only 36% of SNAP participants are non-disabled, non-elderly adults and thus nearly 64% are children, disabled or elderly and their participation may not depend on changes in the unemployment rate (see, ERS 2018; Farm Policy News, January 28, 2018). How much the unemployment rate has impacted participation, or how closely linked the two are, is not clearly known from Chart 3 and more research is needed.
Spending on Farmers: Commodities and Crop Insurance
The main components of the support system for commodity farmers are the farm programs in Title I of the Farm Bill and crop insurance. The information from CBO in Table 1 indicates that farm programs are currently on track to spend roughly $13 billion more than forecast in 2014. At the same time, the outlays for crop insurance are expected to be $11 billion less. Chart 4 provides a comparison of the outlays as projected in 2014 with outlays as reported and updated by CBO. Again year 1 corresponds to crop year 2014 and fiscal year 2016 for farm programs, but fiscal and crop years match for crop insurance.

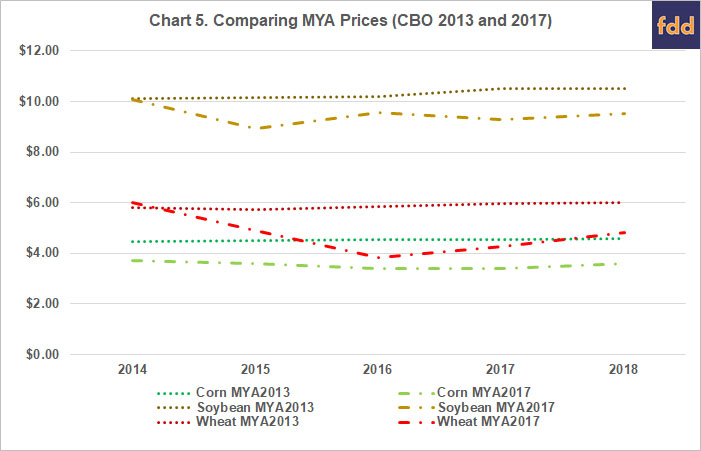
That outlays for the two programs appear to offset is not entirely unexpected given the nature of how each operates on many of the same farms. The outlays highlight the relationship between crop prices and yields. In general, strong yields produce large harvests and supplies which, in turn, cause relatively lower prices. Crop price declines are the main driver of spending on Title I farm programs, especially Price Loss Coverage (PLC). Significant spending on the revenue program (Agriculture Risk Coverage (ARC)) also indicates that marketing year average (MYA) crop prices have declined more significantly than county average yields have increased, at least as measured against the 5-year Olympic moving average benchmark revenue. Chart 5 compares the May 2013 forecasted prices for the three largest crops (corn, soybeans and wheat) used to score the 2014 Farm Bill with the updated prices from the June 2017 CBO Baseline.

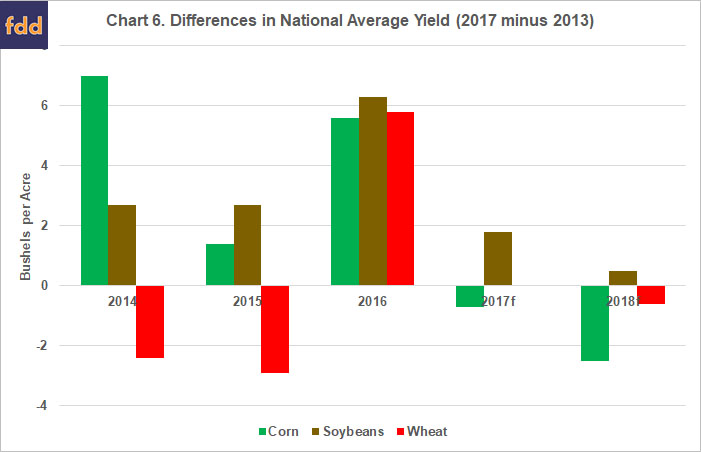
At the same time, strong yields and good crops translate into significantly lower outlays for crop insurance for two reasons. First, good crops translate into fewer and smaller indemnities for losses on insured crops. In fact, RMA indicates that the loss ratio for crop insurance has been well below the statutory requirement for actuarial soundness (1.0); loss ratio was 0.64 in 2015, 0.42 in 2016 and 0.44 in 2017 (see, RMA Summary of Business Report, January 29, 2018). Second, lower crop prices translate into a lower value for the insured crop. This results in lower premium costs and reduced outlays for the federal share of the premium. Chart 6 compares the May 2013 CBO forecasted yields for the three largest crops (corn, soybeans and wheat) with the updated yields in the June 2017 CBO Baseline. The June 2017 Baseline included actual national average yields for the 2014 through 2016 crop years, which were higher for corn and soybeans. The 2016 crop year yields for wheat were also higher than projections from 2013. Yields for 2017 and 2018 were updated forecasts from CBO.

Concluding Comments
In this, the final year of authorization under the 2014 Farm Bill, a review of the outlays from the major mandatory programs provides an important perspective on the bill in operation. Overall, spending is lower than expected when Congress passed the bill. The bulk of the additional savings are from food assistance for low income families in SNAP. In general, the number of persons participating in the program has fallen faster than expected which has reduced spending. Some of this is likely due to the unemployment rate falling faster than expected.
By comparison, crop yields and prices, as well as the relationship between them, have caused changes in spending for farm programs and crop insurance. Outlays for the two have moved in opposite directions. The relatively low prices have resulted in larger outlays from farm programs than expected. Lower prices and strong yields, however, tend to offset that extra farm program spending through reduced outlays for crop insurance (indemnities and premium).
Finally, this simple analysis of outlays can serve as a reminder about these federal policies. Designed as safety net policy, the major programs of the farm bill provide assistance contingent on factors outside the control of those who benefit: lost jobs and reduced incomes; yield loss due to weather or income loss due to low prices and weather-reduced yields. These aspects of the policy may well be lost if the sole measure of a farm bill is the amount of spending that can be cut.
References
Congressional Budget Office. " H.R. 2642, Agricultural Act of 2014." January 28, 2014. https://www.cbo.gov/publication/45049
Congressional Budget Office. "CBO's May 2013 Baseline for Farm Programs." May 14, 2013. https://www.cbo.gov/sites/default/files/recurringdata/51317-2013-05-usda.pdf
Congressional Budget Office. Baseline Projections for Selected Programs. https://www.cbo.gov/about/products/baseline-projections-selected-programs#1
Good, K. "Focus on SNAP, the Largest Farm Bill Program." Farm Policy News, Department of Agricultural and Consumer Economics, University of Illinois at Urbana-Champaign, January 28, 2018.
Oliveira, V., M. Prell, L. Tiehen, and D. Smallwood. "Design Issues in USDA's Supplemental Nutrition Assistance Program: Looking Ahead by Looking Back." Economic Research Report Number 243, Economic Research Service, United States Department of Agriculture, January 2018. https://www.ers.usda.gov/webdocs/publications/86924/err-243.pdf?v=43124
Risk Management Agency. "Federal Crop Insurance Corp Summary of Business Report for 2015 thru 2018." January 29, 2018. https://www3.rma.usda.gov/apps/sob/current_week/sobrpt2015-2018.pdf
Schnitkey, G., C. Zulauf, J. Coppess, and N. Paulson. "ARC-CO Payment Timing and Cash Rent Bidding." farmdoc daily (6):221, Department of Agricultural and Consumer Economics, University of Illinois at Urbana-Champaign, November 22, 2016.
Disclaimer: We request all readers, electronic media and others follow our citation guidelines when re-posting articles from farmdoc daily. Guidelines are available here. The farmdoc daily website falls under University of Illinois copyright and intellectual property rights. For a detailed statement, please see the University of Illinois Copyright Information and Policies here.


