Mapping the Fate of the Farm, 2018 House Edition
On Friday, May 18, 2018, the House of Representatives defeated the farm bill brought to the floor by the House Ag Committee (H.R. 2, Agriculture and Nutrition Act of 2018) by a vote of 198 to 213 (Office of the Clerk, U.S. House of Representatives, Roll Call vote #205). This is the second consecutive defeat on the House floor of a farm bill reported by the House Ag Committee; it follows on the heels of the defeat in June 2013 (farmdoc daily April 17, 2014). This article reviews the House vote and specific questions about the issues surrounding the Supplemental Nutrition Assistance Program (SNAP) at the center of the partisan disagreement in the House. News reports indicate that the House will reconsider the May 18th vote sometime in late June (McPherson, May 21, 2018).
Vote Counting in the House of Representatives
For orientation in the current House of Representatives (115th Congress, 2nd Session), Figure 1 presents a map of all 435 Congressional districts distinguished by party in the traditional red for Republicans and blue for Democrats. In total there are 235 Republicans and 193 Democrats, with a total of 7 current vacancies, of which 5 were seats held by Republicans and 2 were held by Democrats (U.S. House of Representatives, Press Gallery).
The House Ag Committee reported H.R. 2 on a strict partisan vote; all Republicans on the committee voted to report it and all Democrats on the committee voted against reporting it (farmdoc daily, April 26, 2018). If all Members are present on the House floor, final passage requires 218 votes; H.R. 2 failed 198 to 213. All Democrats voted against final passage (183 against; 10 not voting), while 198 Republicans voted for final passage and 30 voted against it. An additional 7 Republicans did not vote. Figure 2 maps the Republicans who voted against final passage or did not vote. If the House Republicans seek to pass a farm bill without Democratic support, the party leadership will need to secure an additional 20 votes. The search for additional support would begin with these 37 districts.

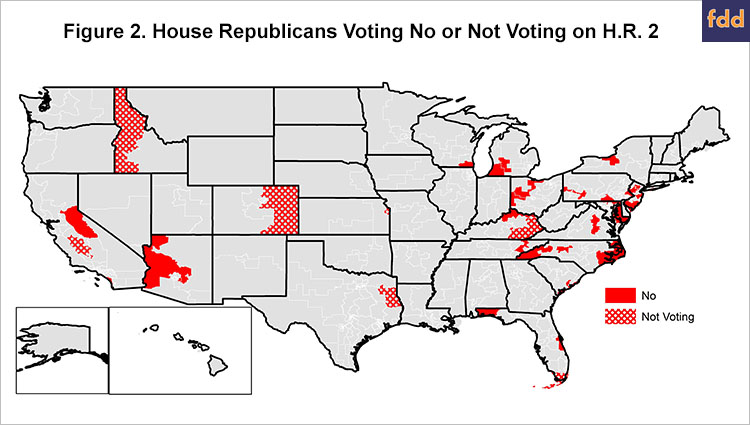
Many observers of the recent farm bill failure blamed an ideological faction within the Republican caucus known as the Freedom Caucus; members of the Freedom Caucus were reported to have voted against the farm bill as a tactic to force a vote on unrelated immigration legislation (Snell and Naylor, May 18, 2018). There is no official membership list for the Freedom Caucus, but news reports indicate that it currently consists of 36 Republicans. Without an official membership list, it is difficult to further analyze the votes of this group and the potential impact on a subsequent vote for the farm bill. News reports have indicated that approximately 12 or 13 of the Republican no votes were Freedom Caucus members (McPherson, May 21, 2018).
Another method for analyzing the fate of the upcoming farm bill re-vote is to look at partisan measures of the districts that voted against the farm bill or did not vote. Figure 3 maps the 37 Republican districts that voted against final passage of H.R. 2 (or did not vote) according to the Partisan Voter Index (PVI) produced by the Cook Political Report (Wasserman and Flinn, April 7, 2017). The PVI is a measure of the partisan makeup of a district based on how it performs compared to the national vote in presidential elections. For example, a PVI of R+5 means that the district performed an average of 5 points more Republican than the nation did in the 2012 and 2016 presidential elections.
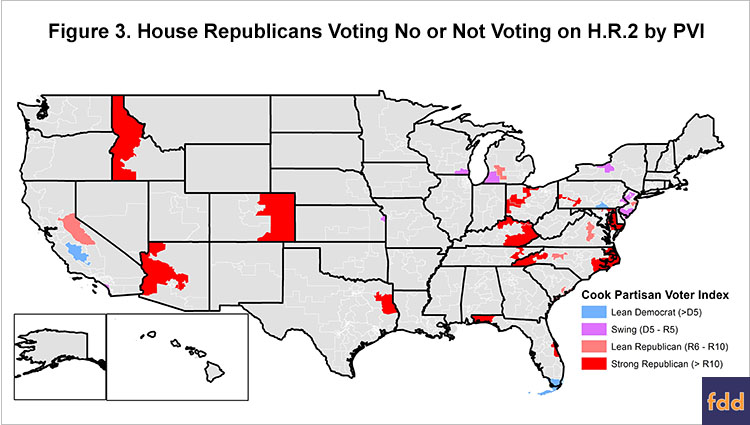
As previously noted, 37 House Republicans either voted no or did not vote for H.R. 2. Of these 37 districts, 18 have a PVI of R+10 or greater, making them strong Republican districts. Four of the 37 districts lean Republican, with a PVI of R+6 to R+10, and 13 of the 27 districts are considered swing districts with a PVI between R+5 and D+5. Finally, the remaining two districts lean Democratic (PVI above D+5).
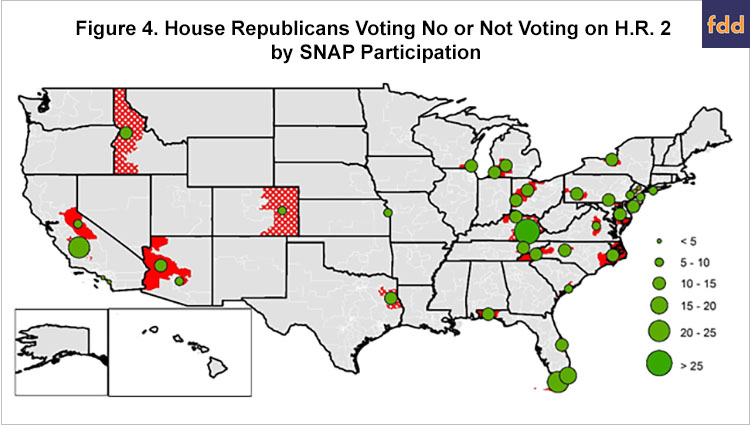
To pass the bill, Republican House Leadership needs to flip 20 votes. Introduction of the politically-difficult immigration issue into a farm bill debate adds significant uncertainty to a bill that was already struggling with partisan political challenges. Whether a vote on immigration will be sufficient to achieve final passage remains unpredictable in part because it will likely require changing more than the 12 or 13 Freedom Caucus votes. As such, the fate of the farm bill in the House becomes a question of which group of Republicans have a reason to flip their votes from opposing the farm bill to supporting it. And that question likely returns to the provisions of H.R. 2, beginning with the revisions to SNAP but not exclusively (see e.g., farmdoc daily, April 26, 2018 (payment limits, AGI and conservation); May 17, 2018 (fixed price policy)). The remainder of the discussion in this article will be on the SNAP revisions in H.R. 2, beginning with Figure 4. Figure 4 maps the percentage of total households in the district that are participating in SNAP for those 37 Republican districts from which the necessary votes are most likely to come. SNAP participation rates were determined by the share of District household receiving SNAP benefits in fiscal year 2016 as reported by USDA’s Food and Nutrition Service (SNAP Community Characteristics).
Reviewing Revisions to SNAP in H.R. 2
Before immigration was pulled into the farm bill debate, the revisions to SNAP were the most partisan and politically difficult. Recall that it was a partisan fight over SNAP that led to the farm bill’s defeat on the House floor in 2013 (farmdoc daily, April 17, 2014; January 10, 2014). Similarly, much of the controversy over SNAP in the current debate involves the House Ag Committee’s revisions to SNAP resulting in fewer people participating in the program or those participating receiving fewer benefits. Notably, many of the proposed changes to SNAP in H.R. 2 would increase spending, mostly on administrative costs and other non-benefit spending. To highlight the political controversy, Figure 5 illustrates only the reductions in spending on benefits as estimated by the Congressional Budget Office (CBO) cost estimate for the reported bill (CBO, May 2, 2018).
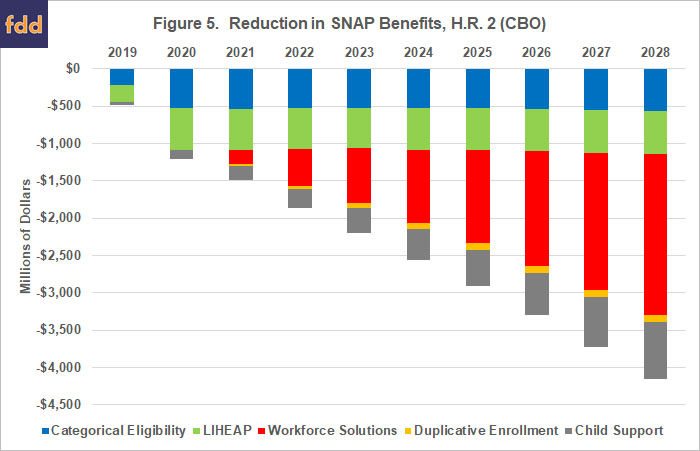
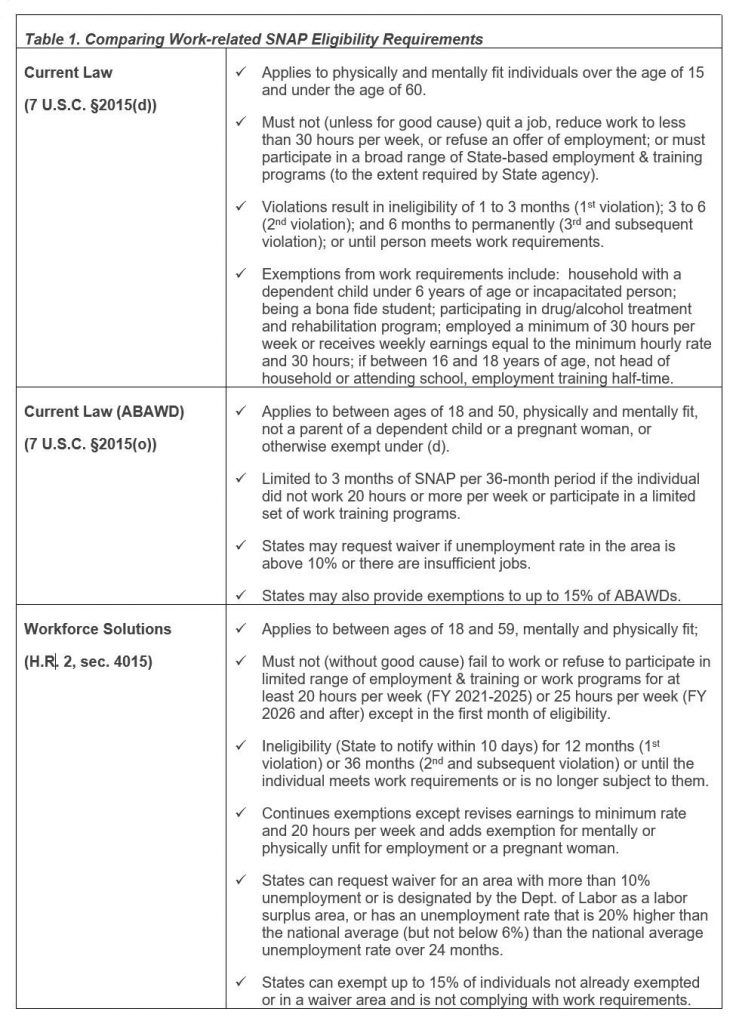
While H.R. 2 would reduce benefits and participants through changes to categorical eligibility, the calculation of energy assistance and duplicative enrollment, much of the focus has been on the revisions to the work-related eligibility requirements. Importantly, current SNAP law includes two sets of work-related eligibility requirements; one set for participating households with children, the elderly or the disabled and a more stringent set of requirements for what are known as able-bodied adults without dependents (ABAWD) (7 U.S.C. §2015(d) and (o); Oliveira et al, 2018). The provisions of H.R. 2, by comparison, would apply more stringent work-related eligibility requirements to all households and individuals participating in SNAP. Table 1 compares current law for work-related eligibility requirements with the changes proposed by the House Ag Committee.
The Congressional Budget Office cost estimate provides further perspective on both the changes to these requirements, as well as the shift in spending as between benefits and administrative or other non-benefit costs. CBO reports that H.R. 2’s workforce provisions would reduce spending on SNAP benefits by a total of $9.19 billion over 10 years (CBO Cost Estimate). At the same time, these provisions would increase direct spending for administrative and other non-benefit costs by $7.65 billion over 10 years, mostly through additional funding for employment and training programs in the States. Figure 6 illustrates this portion of the CBO score by comparing the increased spending for administration and other non-benefit costs with the decreased spending for SNAP benefits.
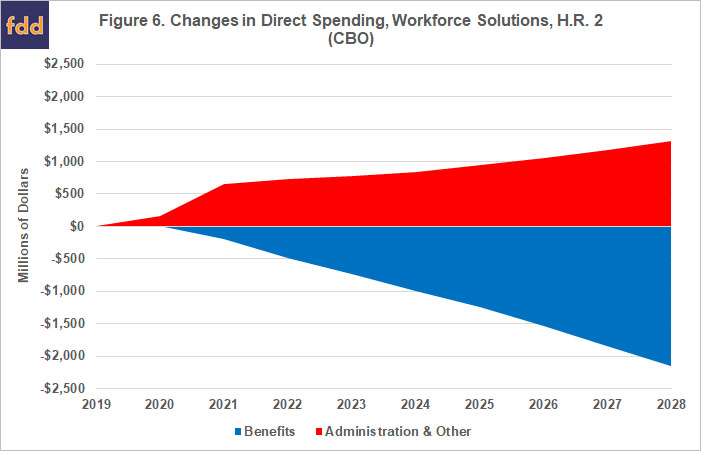
CBO explained further that it estimated that a total of 1.2 million fewer people would receive SNAP benefits in an average month under the revisions to work-related eligibility requirements proposed in H.R. 2, and that fully 62% of those individuals would be adults between the ages of 18 and 49 who live in households with children over 6 years of age. CBO estimated that 17% of current SNAP recipients would be impacted by the work-related eligibility requirement revisions in H.R. 2 and that 24% of those individuals would no longer receive benefits compared with 31% who would work enough hours to meet the requirements.
The CBO estimates are only part of the picture, however. Underlying much of the controversy about H.R. 2 are the operating assumptions of the House Ag Committee in the revisions proposed; assumptions that include the relationship between SNAP and employment. SNAP generally works in a counter-cyclical fashion with the overall economy. Simply put, the program provides assistance to low-income persons, families and households to purchase food which isn’t necessarily just those who are unemployed. In fact, USDA research indicates that many SNAP recipients do work. Using fiscal year (FY) 2015 data, the Economic Research Service (ERS) found that approximately 32% of all SNAP households had earnings from work, while approximate 64% of all SNAP participants were children, elderly or non-elderly adults with disabilities (Oliveira et al, 2018). Participation in SNAP is therefore impacted by factors in the economy in addition to unemployment, such as wages (income), living expenses and poverty.
An improving economy has resulted in a steady decrease in the unemployment rate, as well as in SNAP participation. USDA reported that FY 2017 marked the fourth consecutive year that participation in SNAP decreased (Oliveira, 2018). Data from USDA’s Food and Nutrition Service indicates that participation in SNAP peaked at approximately 47.8 million people in December 2012 and decreased to 41.4 million in December 2017; a decrease in participation of more than 6 million people (USDA-FNS SNAP Program Data). Additionally, CBO has forecast participation will continue to decrease without the revisions in H.R. 2. The April 2018 CBO Baseline estimates participation falling to a monthly average of 32.1 million persons by 2028, which would represent at total decrease of over 15 million persons from peak participation (CBO April 2018 Baseline; farmdoc daily, April 12, 2018).
The Bureau of Labor Statistics at the U.S. Department of Labor (BLS) produces the unemployment rate and provides other employment data. BLS reported that unemployment peaked at 10% unemployment in October 2009, with total nonfarm employment at 130 million persons (Dept. of Labor, Bureau of Labor Statistics). By comparison, in December 2017, BLS reported unemployment at 4.1% and total nonfarm employment at 147.6 million persons; an increase of over 17 million.
SNAP, however, is not simply assistance for unemployment; it is assistance to low-income persons, families and households which is generally those with incomes below 130% of the poverty level. The U.S. Census Bureau reports the number of persons living in the U.S. as well as data on income and poverty (U.S. Census Bureau, Income and Poverty in the United States). For example, in 2016 the poverty threshold for an individual under the age of 65 was $12,486 and for a family of four it was $24,563. Accordingly, a family of four with income below $31,932 should generally qualify for SNAP benefits (depending on other eligibility requirements). Figure 7 compares the yearly average of the monthly unemployment rate to the percentage of the monthly average number of persons participating in SNAP (divided by population) and the percentage of persons living below poverty according to the Census Bureau.
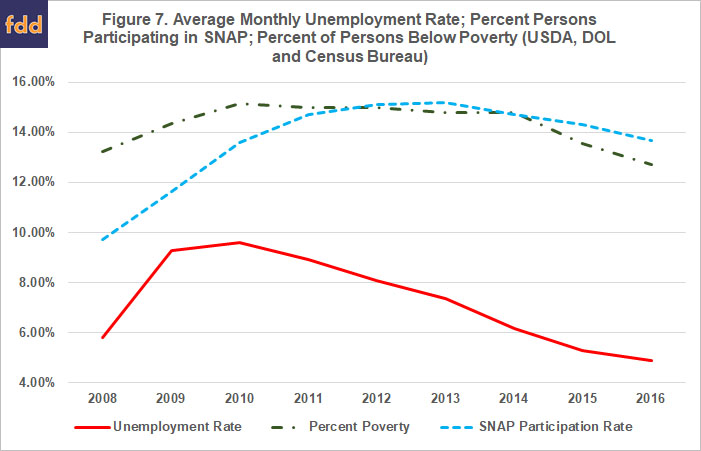
Notable in Figure 7 is the continued higher rate of poverty even as the unemployment rate falls, which necessarily impacts the SNAP participation rate. Similar to the comparison in Figure 7, USDA has explained that SNAP is generally tied to the health of the economy (e.g., unemployment rates and poverty) but that “the improvement in economic conditions during the early stage of recovery may take longer to be felt by lower educated, lower wage workers who are more likely to receive SNAP benefits, resulting in a lagged response of SNAP participation to a reduction in the unemployment rate” (Oliveira 2018, at 12). The information available at this point in the overall economic recovery appears to support USDA’s conclusion and that continued economic strength should improve incomes, lifting more people out of poverty and allowing them to move off of SNAP.
Concluding Thoughts
Many would welcome the information in the above discussion as a positive development and an endorsement of the counter-cyclical nature of a functioning safety net program. The data on improving employment, declining poverty and SNAP participation does not appear to have helped the debate over SNAP and the farm bill, however. H.R. 2 is expected to reduce participation in SNAP further than that being accomplished by the improving economic situation. It would also reduce benefits for participating households while increasing the administrative costs of the program and other non-benefit spending. The result has been a farm bill debate more partisan than the previous one with yet another politically painful defeat on the House floor. This deteriorating political situation has also allowed introduction of additional, and possibly more difficult, partisan matters such as immigration to the farm bill debate. In all, the fate, not only of this particular bill (H.R. 2) but potentially of future efforts as well, appears increasingly in doubt. Extreme partisanship and polarization appear to be tearing apart the coalition that has supported reauthorization since 1964, while magnifying institutional concerns about the House of Representatives (Patty, May 21, 2018).
References
Congressional Budget Office, Cost Estimate, H.R. 2 Agriculture and Nutrition Act of 2018, May 2, 2018, https://www.cbo.gov/publication/53819
Congressional Budget Office, Supplemental Nutrition Assistance Program—CBO’s April 2018 Baseline, https://www.cbo.gov/sites/default/files/recurringdata/51312-2018-04-snap.pdf
Coppess, J., G. Schnitkey, N. Paulson, and C. Zulauf. "Comparing Price Policy Directions in the 2018 Farm Bill Debate." farmdoc daily (8):90, Department of Agricultural and Consumer Economics, University of Illinois at Urbana-Champaign, May 17, 2018.
Coppess, J., G. Schnitkey, C. Zulauf, and N. Paulson. "Initial Review of the House 2018 Farm Bill." farmdoc daily (8):75, Department of Agricultural and Consumer Economics, University of Illinois at Urbana-Champaign, April 26, 2018.
Coppess, J., G. Schnitkey, C. Zulauf, and N. Paulson. "Reviewing the CBO Baseline for 2018 Farm Bill Debate." farmdoc daily (8):65, Department of Agricultural and Consumer Economics, University of Illinois at Urbana-Champaign, April 12, 2018.
Coppess, J., C. Zulauf, G. Schnitkey, and N. Paulson. "Reviewing the State of the Farm Bill: Perspective from Spending." farmdoc daily (8):16, Department of Agricultural and Consumer Economics, University of Illinois at Urbana-Champaign, February 1, 2018.
Kuethe, T., and J. Coppess. "Mapping the Fate of the Farm Bill: A Closer Look at SNAP." farmdoc daily (4):3, Department of Agricultural and Consumer Economics, University of Illinois at Urbana-Champaign, January 10, 2014.
Kuethe, T., and J. Coppess. "Mapping the Farm Bill: Voting in the House of Representatives." farmdoc daily (4):70, Department of Agricultural and Consumer Economics, University of Illinois at Urbana-Champaign, April 17, 2014.
McPherson, L. “Scalise Announces Plan for Immigration, Farm Bill Votes Third Week of June,” Roll Call, Politics, May 21, 2018, https://www.rollcall.com/news/politics/scalise-farm-bill-june-22
Patty, J. “What the farm bill’s failure says about congressional function: Congress needs to get on the policymaking road again,” Vox.com, May 21, 2018, https://www.vox.com/mischiefs-of-faction/2018/5/21/17373290/congress-2018-farm-bill
Oliveira, V., 2018. “The Food Assistance Landscape: FY2017 Annual Report,” U.S. Dept. of Agriculture, Economic Research Service, Economic Information Bulletin No. EIB-190, https://www.ers.usda.gov/webdocs/publications/88074/eib-190.pdf?v=43174
Oliveira, V., M. Prell, L. Tiehen, and D. Smallwood, 2018. “Design Issues in USDA’s Supplemental Nutrition Assistance Program: Looking Ahead by Looking Back,” U.S. Dept. of Agriculture, Economic Research Service, Economic Research Report No. ERR-243, https://www.ers.usda.gov/webdocs/publications/86924/err-243.pdf?v=43124
Snell, K. and B. Naylor. “House Farm Bill Fails as Conservatives Revolt Over Immigration,” NPR.com, Politics, May 18, 2018, https://www.npr.org/2018/05/18/612203191/house-farm-bill-in-jeopardy-as-leaders-court-conservatives
Wasserman, D. and A. Flinn, “Introducing the 2017 Cook Political Report Partisan Voter Index,” The Cook Political Report, April 7, 2017, https://www.cookpolitical.com/introducing-2017-cook-political-report-partisan-voter-index
Disclaimer: We request all readers, electronic media and others follow our citation guidelines when re-posting articles from farmdoc daily. Guidelines are available here. The farmdoc daily website falls under University of Illinois copyright and intellectual property rights. For a detailed statement, please see the University of Illinois Copyright Information and Policies here.


