


Changes in Farms and Farmland in Illinois
The Census of Agriculture is a national account of all U.S. farms, ranches, and operators. The Census is conducted every five years and provides valuable information on land use and ownership, operator characteristics, production practices, income and expenditures. The USDA recently released a comprehensive report of state and county-level farm and ranch statistics for the 2017 Census of Agriculture (available here). This article examines the changes in the number of farm operations and farmland acreage across the State of Illinois between the 2017 and 2012 Censuses.
Number of Farms in Illinois
The Census defines a farm as “any place from which $1,000 or more of agricultural products were produced and sold, or normally would have been sold, during the census year.” This definition has been used since 1974. According to the 2017 Census of Agriculture, the United States is home to 2,042,220 farms, 72,651 (3.6%) of which are located in Illinois. On aggregate, the number of U.S. farms declined by 3.2% since the previous Census in 2012. Illinois experienced the same percentage decline in the number of farms with the loss of 2,436 farms.
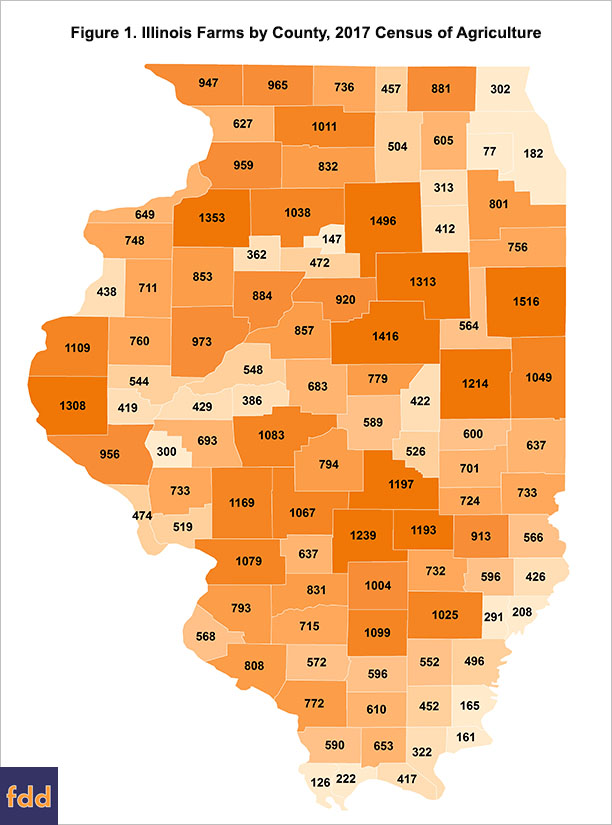
Figure 1 shows the distribution of farms in Illinois by county based on the 2017 Census of Agriculture, with the darker colors representing more farms. The number of farms varies to some degree by the geographic size of the county. Iroquois County is home to the greatest number of farms at 1,516, and DuPage County is home to the fewest number of farms at 77.
While the State as a whole experienced a decline in the number of farms between 2012 and 2017 Censuses, 35 of Illinois’ 102 counties (34.3%) experienced an increase in the aggregate farm numbers. Figure 2 shows the percent change in the number of farms between the 2012 and 2017 Censuses by county. Counties that experienced a decline in total number of farms are shown with varying shades of red, and counties that experienced an increase in the total number of farms are shown with varying shades of blue. Hamilton County had the greatest loss in total number of farms in percentage terms at –20.6% (from 695 farms in 2012 to 552 farms in 2012), and Cook County had the greatest increase in total farm number of farms in percentage terms at +43.3% (from 127 farms in 2012 to 182 farms in 2017).

Land in Farms in Illinois
The Census of Agriculture defines “land in farms” as “agricultural land used for crop, pasture, or grazing,” but also includes “woodland and wasteland not actually under cultivation or used for pasture or grazing, provided it was part of the farm producer’s total operation” and various farmland retirement program acreage. According to the 2017 Census of Agriculture, the United States is home to over 900 million acres of farmland, a little over 27 million acres (3.0%) of which are located in Illinois. On aggregate, U.S. farm acreage declined by 1.6% since the 2012 Census. In Illinois, however, farmland acreage increased by 68,567 acres or 0.3%.
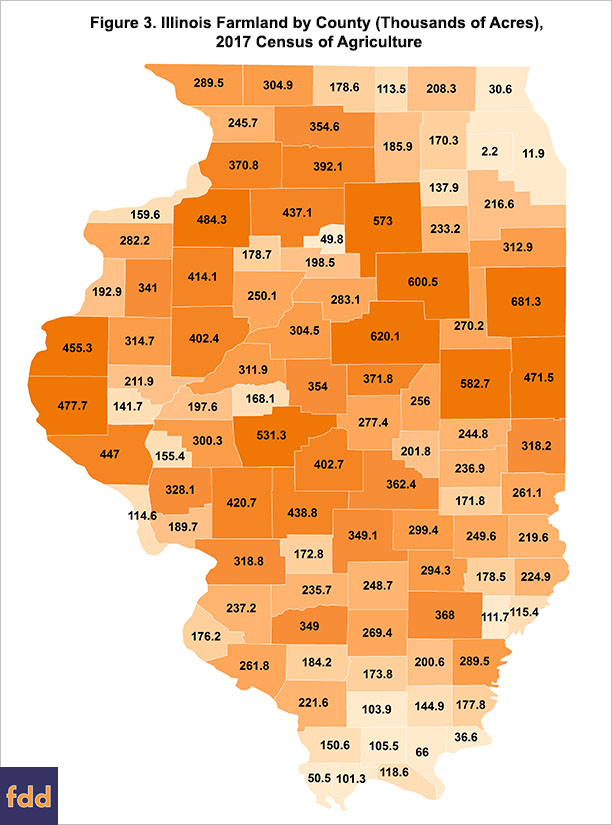
Figure 3 shows the distribution of farmland in Illinois by county based on the 2017 Census of Agriculture, with the darker colors representing more acreage. The acreage varies to a large extent by the geographic size of the county. DuPage has the smallest amount of farmland acreage at 2,160 acres, and Iroquois County has the most farmland acreage at 681,289 acres.
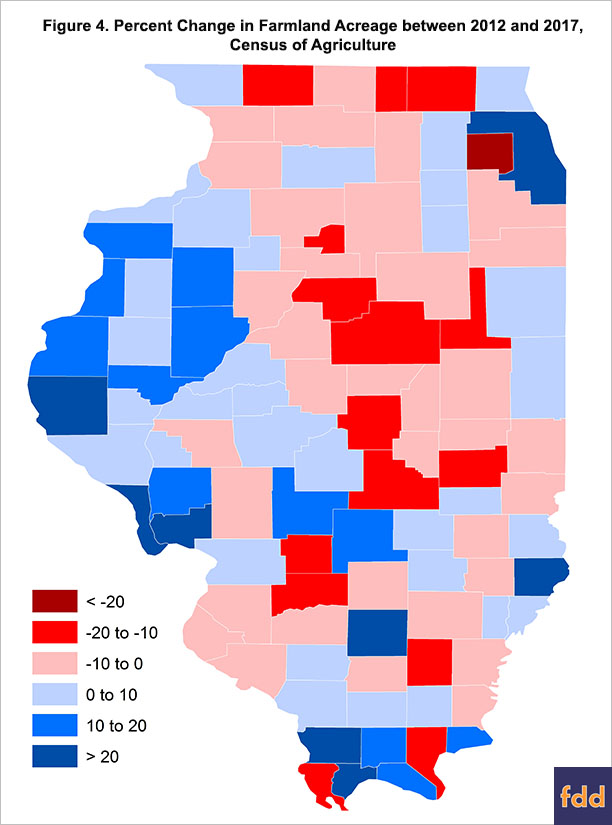
As previously stated, land in farms increased between the 2012 and 2017 Censuses, and 52 of Illinois 102 counties (51%) experienced in an increase in farmland acreage. Figure 4 shows the percent change in land in farms between the 2012 and 2017 Censuses by county. Counties that experienced a decline in acreage are shown with varying shades of red, and counties that experienced an increase in acreage are shown with varying shades of blue. Cook County experienced the largest growth of land in farms at 40.1%, and DuPage County experienced the greatest loss in farmland at –70.2%.
References
USDA, National Agricultural Statistics Service. “2017 Census of Agriculture.” https://www.nass.usda.gov/Publications/AgCensus/2017/index.php
USDA, National Agricultural Statistics Service. “2017 Census of Agriculture: Illinois State and County Data.” https://www.nass.usda.gov/Publications/AgCensus/2017/Full_Report/Volume_1,_Chapter_2_County_Level/Illinois/ilv1.pdf
Disclaimer: We request all readers, electronic media and others follow our citation guidelines when re-posting articles from farmdoc daily. Guidelines are available here. The farmdoc daily website falls under University of Illinois copyright and intellectual property rights. For a detailed statement, please see the University of Illinois Copyright Information and Policies here.