


MFP Impact on 2019 through 2023 Incomes and Financial Positions
We provide projections of financial performance over the next five years for two farms: one in central Illinois and one in northern Illinois. Northern Illinois has been much harder hit with wet weather than central Illinois, resulting in lower projected yields than for northern Illinois. Market Facilitation Program (MFP) payments in 2019 of $50 per acre will reduce financial erosion on farms. Still, incomes for 2019 are projected to be over $100,000 lower than 2018 incomes. The northern Illinois farm is projected to have serious declines in liquidity. Given trend yield projections and current price projections, farms will have recurring losses in financial position over the next five years.
Background
The Gardner Farm Income and Policy Simulator (GFIPS) simulates farm financial performance for five years beginning with the base year balance sheet and farm size information (farmdoc daily, March 6, 2018). GFIPS works through detailed economic and financial modeling using a case farm developed from data collected by the Illinois Farm Business Farm Management Association (FBFM). A more detailed description of the model is available at (farmdoc daily, March 6, 2018). The model has been updated with 2018 data and begins with 2018 as the base year.
Financial Position of Central Illinois High-Productivity Farm
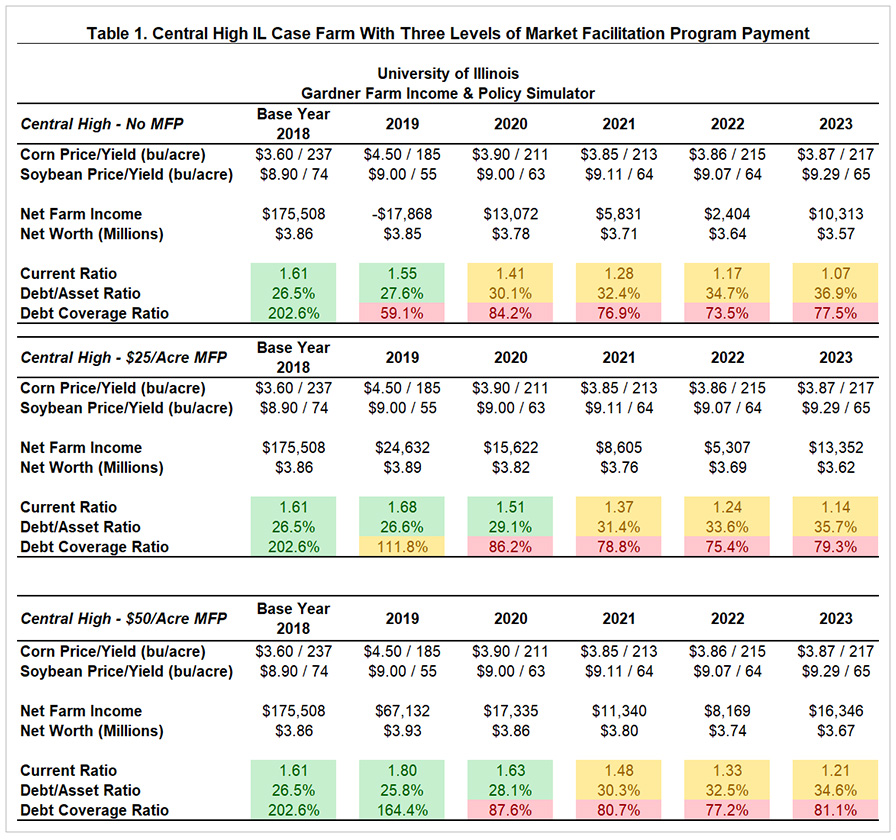
The case farm for central Illinois has high-productivity farmland and farms 1,700 acres with 11% owned, 42% share-rented, and 47% cash-rented. The farm is planted 51% to soybeans and 49% to corn, the average ratio for farms of this size in the region. The average cash rent is $274 per acre in 2018. In 2018, the farm had $175,508, of which $53,439 come from 2018 MFP payments. Despite the drop in corn and soybean prices in the second half of 2018, incomes were strong due to exceptional yields and because farmers were able to presell grain at higher prices before impact of the trade conflict and large crops were factored into market prices. Net worth at the end of 2019 is $3,860,000 (see Table 1).
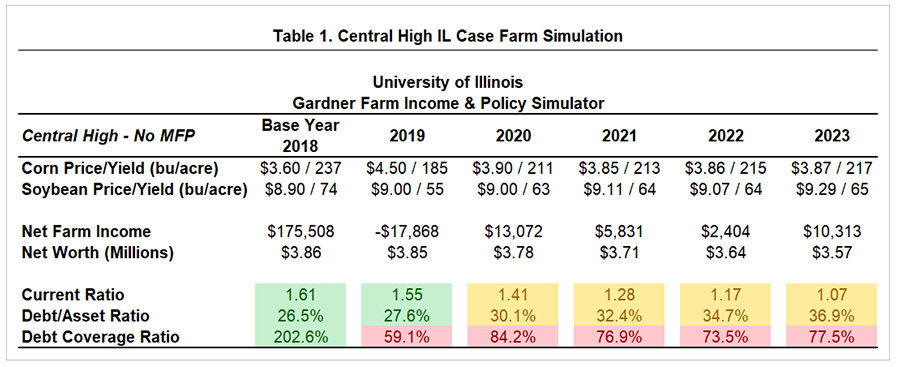
For 2019, farm incomes are simulated with a 185 bushel per acre corn yield and a 55 bushel per acre soybean yield, considerably lower than 2018 yields due to wet spring weather and late planting. In 2018, actual yields for this farm type were 237 bushels per acre for corn (52 bushels higher than estimated for 2019) and 73 bushels per acre for soybeans (18 bushels higher than estimated 2019 yields). The 2019 corn price is $4.50 and soybean price is $9.00. Without any MFP payment, 2019 net income is -$17,508, $193,376 less than the $175,508 net income in 2018. Despite the expectation for slightly higher soybean prices and considerably higher corn prices, the weather induced low yields for 2019 mean farmers will have less grain to sell at those prices, contributing to lower incomes.
Projections for 2021 to 2023 are made with CBO prices, adjusted for average historical deviations in actual price received, which are in the $3.80 range for corn and $9.00 range for soybeans. Yields are at trend levels: roughly 215 bushels per acre for corn and 64 per bushels per acre for soybeans (see farmdoc daily, March 20, 2018; farmdocDaily, May 10, 2017). These trend yields are considerably lower than exceptional yields achieved in central Illinois from 2015 through 2018, and will result in low incomes. From 2021 through 2023, net farm incomes are projected to be below $15,000.
The projected low incomes in 2019 through 2023 would result in serious erosion of financial health of farms. In Table 1, financial ratios are color-coded to represent an acceptable range (green), questionable range (yellow), and warning zone (red).
Current ratio equals current assets divided by current liabilities and is a measure of working capital. Without a MFP payment, the current ratio drops from 1.61 in 2018 to 1.55 in 2019, then declines annually to 1.07 in 2023.
The debt-to-asset ratio equals debt divided by assets. Higher debt-to-asset ratios mean higher debt relative to assets. Without a MFP payment, the debt-to-asset ratio worsens in 2019 from 26.5% to 27.6%, with the higher number representing a larger level of debt relative to assets.
The debt coverage ratio measures the farm’s ability to provide for debt payments. The starting value of 202.6% means the farm generates 102.6% more funds, or more than double sufficient funds to cover debt obligations. A ratio below 100% means that the farm is not generating sufficient funds to cover debt payments. Without a MFP payment, debt coverage makes a huge drop from a strong coverage level at the end of 2018 to a weak level of 59.1% at the end of 2019.
Market Facilitation Program and Central Illinois High-Productivity Farm
USDA has not announced payment rates for the Market Facilitation Program (MFP) but has stated that all MFP-eligible planted crops in a county will receive the same per acre payment. In the meantime, MFP payments must be estimated. The simulation evaluates performance of a single case farm at three different MFP levels: one with a $0 per acre MFP payment, one with a $25 per acre MFP payment, and one with a $50 per acre MFP payment.
Table 2 shows net farm income over the projection period when there is no MFP payment (the case given above), a $25 per acre payment, and a $50 per acre MFP payment. Without a MFP payment this farm would face a net loss of -$17,868 in 2019. A $25 per acre MFP payment brings net income up to $24,632. With a $50 per acre MFP payment net farm income is projected at $67,132, still a significant decline from $175,508 in 2018.
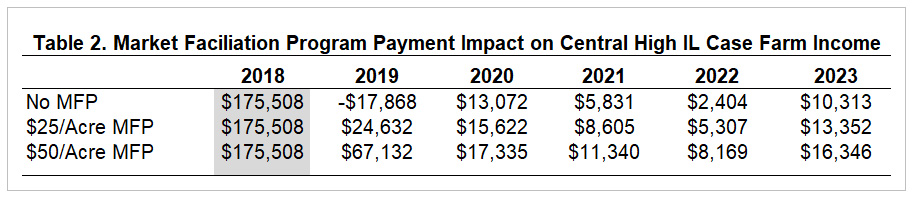
Note that a 2019 MFP payment has lingering impacts on net income in future years. Without a MFP payment, the farm accumulates additional debt, with interest costs. These interest costs are added into farm expenses and result in decreased net incomes in future years. For example, the farm ended 2019 with $1.12 million of debt with a $50 per acre MFP payment, but $1.20 million of debt without a MFP payment. Conversely, a farm receiving a MFP payment has a larger tax liability in 2019, and all future years, due to higher incomes. However, the additional income tax payment is minimal compared to the burden of additional debt without a MFP payment.
Not only does the higher level of debt impact income, it also takes a toll on net worth and important ratios used to gauge financial health of a farm (see Table 3). Without a MFP payment both liquidity and solvency of the farm worsen in 2019, but receipt of a MFP payment allows the farm to maintain near starting levels or even improve depending on the size of the payment.
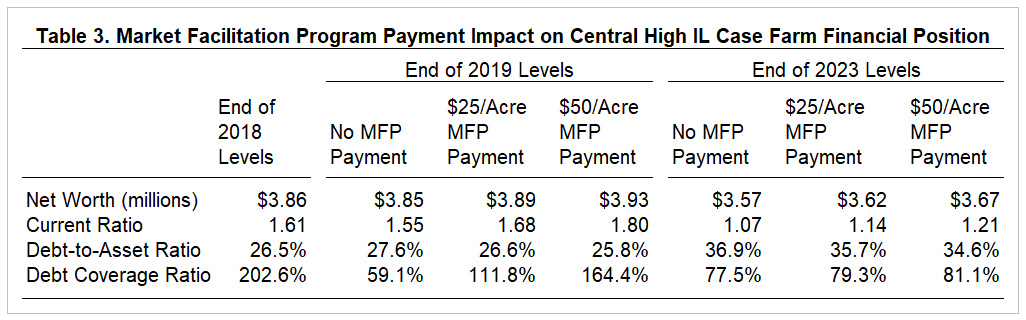
Without a MFP payment capacity, as represented by debt coverage ratio, falls from a strong coverage level with double the capacity to cover debt obligations to a poor coverage level with only 59% of the capacity to cover debt obligations. Receiving a MFP payment of at least $25 per acre, puts the farm in a position to meet debt obligations.
Due to the cumulative impact of a 2019 MFP payment, the higher the payment, the comparatively better status at the end of 2023. However, regardless of 2019 MFP payment, all measures of financial health deteriorate from the 2019 end-point throughout the remainder of the projection period.
Financial Position of Northern Illinois Farm
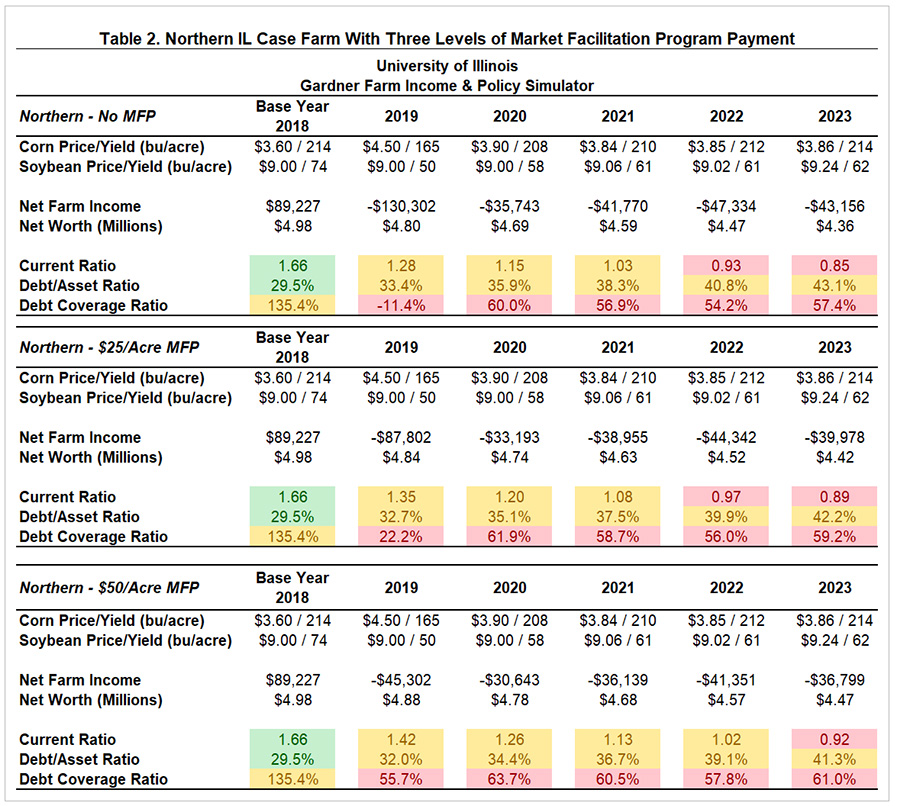
A northern Illinois case farm is simulated using the same methodology as the central Illinois case farm. A total of 1,700 acres are farmed with 21% owned, 18% share-rented, and 61% cash-rented. The farm is planted 61% to corn and 39% to soybeans, the average ratio for farms of this size in the region. The average cash rent is $253 per acre in 2018. In 2018, the farm had $89,227 of simulated net farm income and net worth of $4,980,000 (see Table 4). When simulating the northern Illinois farm, we assumed all acres were planted. Prevented planting acres will result in much lower projected incomes.
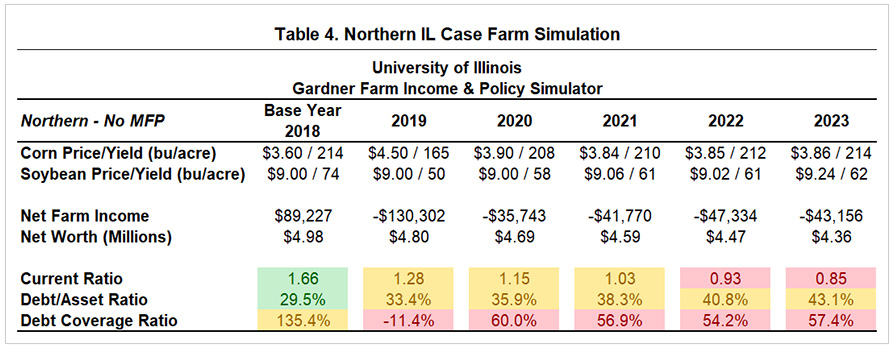
For 2019, farm incomes are simulated with a 165 bushel per acre corn yield and a 50 bushel per acre soybean yield, considerably lower than 2018 yields due to wet spring weather and late planting. In 2018, actual yields for this farm type were 214 bushels per acre for corn (49 bushels higher than estimated for 2019) and 74 bushels per acre for soybeans (24 bushels higher than estimated 2019 yields). The 2019 corn price is $4.50 and soybean price is $9.00. Without any MFP payment, 2019 net incomes are -$130,302, $219,529 less than the $89,227 net income in 2018.
Projections for 2021 to 2023 are made using the same prices as for central Illinois: $3.80 range for corn and $9.00 range for soybeans. Yields are at trend levels: roughly 212 bushels per acre for corn and 61 per bushels for soybeans (see farmdoc daily, March 20, 2018; farmdocDaily, May 10, 2017). Similar to central Illinois, trend yields are considerably lower than exceptional yields achieved in the area from 2015 through 2018, and will result in low incomes. From 2021 through 2023, considerable losses exceeding -$35,000 are projected.
The projected low incomes in 2019 through 2023 would result in serious erosion of financial health of farms. In Table 4, financial ratios are color-coded to represent an acceptable range (green), questionable range (yellow), and warning zone (red).
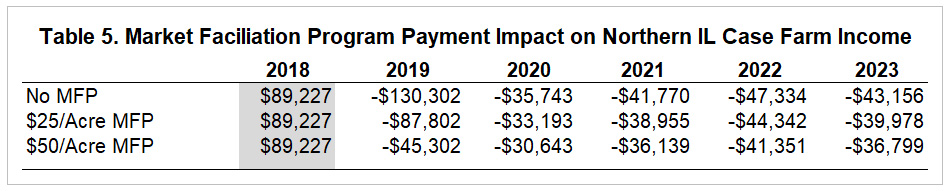
As with the central Illinois case farm, 2019 MFP payments will provide support to income and overall financial position for the northern Illinois case farm. However, even with a $50 per acre MFP payment, this farm still experiences a loss of -$45,302 at the given price and yield levels in 2019.
Unlike the central Illinois case, the northern Illinois farm has negative incomes forecast for 2020 through 2023. Part of the reason is the negative shock in 2019 leading to higher debt levels. Overall, northern Illinois farms have higher asset and higher debt levels than central Illinois farms, leading to higher levels of depreciation and a larger interest cost, both of which contribute to lower projected income.
Summary
Similar to 2018, MFP payments will be a significant component of incomes in 2019. Without MFP payments, incomes would be extremely low and result in degradation of a farm’s financial positon that will have lingering impacts into future years. Because of lower yields, northern Illinois farms will have worse financial outcomes than central Illinois farms.
Incomes in 2019 will vary from the above values. Higher incomes could result if:
- MFP payments are higher than projected in this article,
- Yields are higher than projected in this article,
- Prices are higher than in this article,
Lower yields occur but there is a positive price response to those low yields. The fourth scenario may have the best chance of increasing incomes. In this scenario, yields are worse than projected and market participants begin to recognize those low yields are occurring, resulting in a price response. Lower yields will not reduce income because most farmers have purchased crop insurance, and lower yields will trigger crop insurance payments. Higher prices will increase those payments because most farmers have purchased Revenue Protection (RP) which has a guarantee increase provision. Higher prices will increase RP payments given the same yield shortfall.
Although the level of income in 2019 influences the financial position in future years, no additional variables are changed through the reminder of the projection period. Therefore, the relative changes in financial position from the 2019 year-end starting point are consistent in all three MFP payment scenarios. If prices stay at levels in the simulation and trend yields from 2020-2023, the financial position and net worth weakens throughout the projection period from the 2019 year-end starting point.
Looking past 2019, the financial simulation results indicate picture of caution for future years. These financial results likely will continue as long as corn prices in future years are below $4 per bushel and soybean prices are near or below $9.00 per bushel. Although current prices, particularly corn prices, are supported on expectations for prevent plant acres and low yields for 2019, trade uncertainty and a return to normal production after 2019 will likely curb prices in future years. But as is usual in agriculture, much can change.
References
Irwin, S., T. Hubbs and D. Good. "What’s Driving the Non-Linear Trend in U.S. Average Soybean Yields?." farmdoc daily (7):86, Department of Agricultural and Consumer Economics, University of Illinois at Urbana-Champaign, May 10, 2017.
Schnitkey, G. "Exceptional Corn and Soybean Yields in 2017." farmdoc daily (8):49, Department of Agricultural and Consumer Economics, University of Illinois at Urbana-Champaign, March 20, 2018.
Swanson, K., G. Schnitkey, J. Coppess and N. Paulson. "Introducing the Gardner Farm Income and Policy Simulator." farmdoc daily (8):39, Department of Agricultural and Consumer Economics, University of Illinois at Urbana-Champaign, March 6, 2018.
Appendices
Disclaimer: We request all readers, electronic media and others follow our citation guidelines when re-posting articles from farmdoc daily. Guidelines are available here. The farmdoc daily website falls under University of Illinois copyright and intellectual property rights. For a detailed statement, please see the University of Illinois Copyright Information and Policies here.