


Use of Tile, 2017 US Census of Agriculture
This is the third article on land use practices as reported in the 2017 US Census of Agriculture (see farmdoc daily, July 24 and July 25). Use of tile is examined in this article. Attention on tile has grown in recent years due to increased attention on large rain events. Consistent with this attention, land tiled increased by 7 million acres between the 2012 and 2017 censuses. Both use of tile and its growth is concentrated in states that border the Great Lakes or are in the Corn Belt. This area of rain-fed agriculture has productive soils as prone to periods of excess water as to dryness, making management of excess water important to the realization of production potential.
Census Question
Section 4 of the 2017 Census of Agriculture questionnaire concerned “Land Use Practices.” One of its questions was, “During 2017, considering the total acres on this operation, how many acres were drained by tile? (Appendix B, page B-30).
Tile in 2017
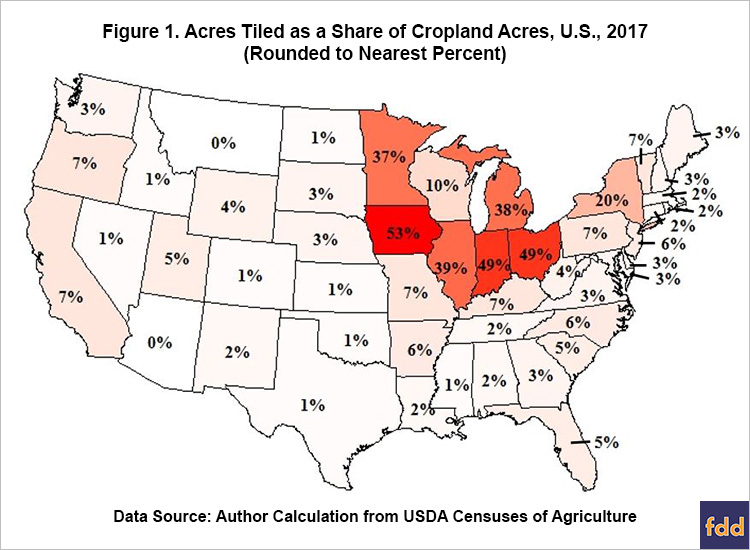
A total of 56 million US acres were reported as being drained by tile in the 2017 census, a 14% increase from 49 million acres in the 2012 census. Acres tiled were 14% of total US cropland in 2017, compared with 11% in 2012. The share was 20% or more in 7 states: Iowa (53%), Indiana (49%), Ohio (49%), Illinois (39%), Michigan (38%), Minnesota (37%), and New York (20%) (see Figure 1). Next highest share was 10% for Wisconsin. These Corn Belt and Great Lake states are historically associated with using tile to drain their highly productive soils. Acres tiled rounded to 0% of cropland for Alaska, Arizona, Hawaii, and Montana.
Change from 2012
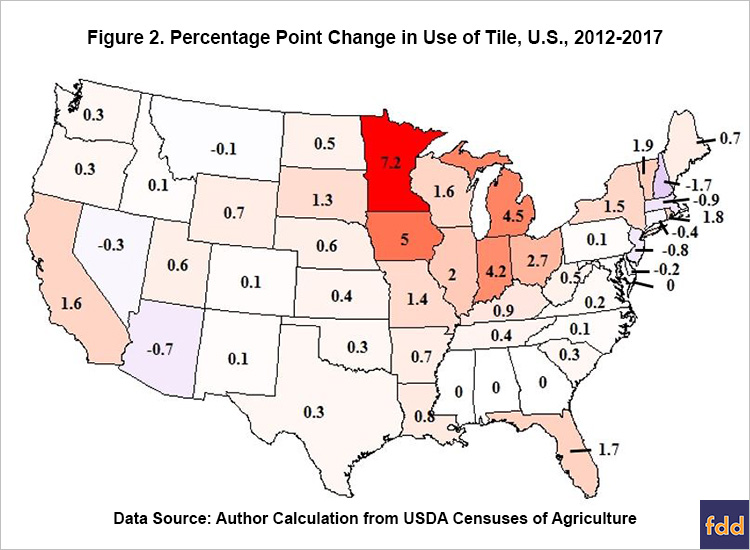
Acres tiled increased in 77% of the 48 states for which tiled acres were reported in the 2012 census (see Figure 2 and Data Note). Acres tiled increased 1.6 and 1.5 million acres in Minnesota and Iowa, respectively. Six of the seven states with the highest share of tiled acres to cropland in 2017 had the highest percentage point (pp) increase in this share from 2012 to 2017: Minnesota (+7.2 pp), Iowa (+5.0 pp), Michigan (+4.5 pp), Indiana (+4.2 pp), Ohio (+2.7 pp), and Illinois (+2.0 pp). Correlation between acres tiled relative to cropland in 2012 and the increase in this share from 2012 to 2017 was +0.79, implying acres tiled as a share of cropland in 2012 explained 62% (62% = 0.79 squared) of the variation across states in the change in share between 2012 and 2017. Thus, despite the downturn in farm prices and returns since 2012, farmers in areas where tile is common continued to invest in this land management practice. However, the largest percent increase in acres tiled was the adjoining states of North Dakota (+109%), Kansas (+73%), and South Dakota (+69%).
Summary Observations
- Use of tile to drain land is concentrated in US states that border the Great Lakes or are considered traditional Corn Belt states. These states account for over 85% of all tiled US acres as of 2017.
- Farmers and land owners continued to invest in tile even after the post-2012 price and revenue decline. Acres tiled increased by 7 million between the 2012 and 2017 Censuses of Agriculture.
- This continued investment in tile likely partly reflects the growing discussion among farmers and others about the increasing frequency of large rain events.
- It is reasonable to speculate that the wet weather experienced so far in 2019 may stimulate further interest in tiling land both in the historical core US area for tile as well as adjoining areas.
Data Note
Acres tiled was not reported for Alaska and Rhode Island in the 2012 Census of Agriculture to avoid disclosing data for individual farms.
References
US Department of Agriculture, National Agricultural Statistics Service. (April 2019). 2017 Census of Agriculture: United States Summary and State Data. Volume 1, Geographic Area Series, Part 51. AC-17-A-51 www.agcensus.usda.gov
Zulauf, C. and B. Brown. "Cover Crops, 2017 US Census of Agriculture." farmdoc daily (9):135, Department of Agricultural and Consumer Economics, University of Illinois at Urbana-Champaign, July 24, 2019.
Zulauf, C. and B. Brown. “Tillage Practices, 2017 US Census of Agriculture.” farmdoc daily (9): 136. Department of Agricultural and Consumer Economics, University of Illinois at Urbana-Champaign. July 25, 2019.
Disclaimer: We request all readers, electronic media and others follow our citation guidelines when re-posting articles from farmdoc daily. Guidelines are available here. The farmdoc daily website falls under University of Illinois copyright and intellectual property rights. For a detailed statement, please see the University of Illinois Copyright Information and Policies here.