


farmdoc and farmdoc daily Crop Insurance Contributions – 20 years and Counting
This is the third in a series of articles celebrating the 20th anniversary of farmdoc. A list of all nine articles in the series and authors can be found at the end of this article.
In preparation for the 20th Anniversary of the farmdoc program, we are highlighting several of the central themes that have persisted through time and are identifying some of the ways in which the farmdoc program has responded to, and continues to contribute to producers’ key decisions. Among the most important risk management activities – dramatically highlighted by this year’s weather and developing production situation – involves the ever-changing crop insurance options that a producer has access to, and their interactions with other government programs. Simply put, crop insurance is the central part of many producer’s risk management programs and is among the most visible components of the federal farm programs. In response, the farmdoc team has developed several tools and educational materials to help make sense of the complex decisions faced related to crop insurance, and to government farm programs in general. The purpose of this post is to simply document the general features of the federal crop insurance program through time, and to highlight the ways some of the tools can be used to improve farm-level decision making.
Growth in importance of Crop Insurance
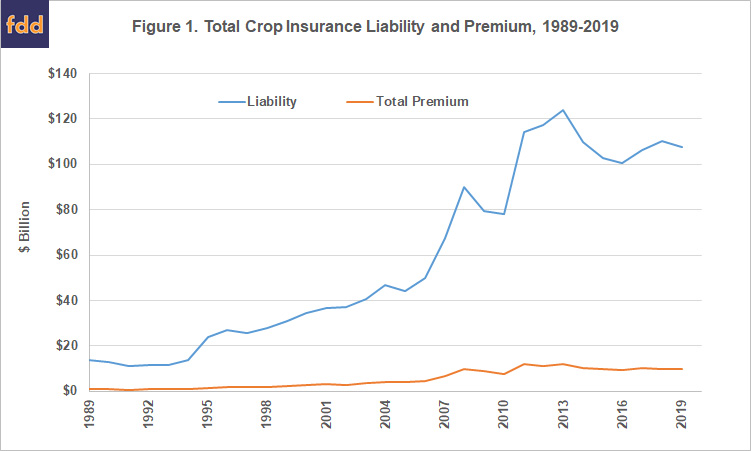
First, to understand the growth through time and current importance of the programs, see Figure 1 which shows the total program liability and premiums through time from 1989 to present. The total liability, or amount of insurance in place, peaked in 2013 at almost $124 billion and has averaged just under $110 billion per year over the most recent decade. Total premiums, or the amount paid for the insurance, has averaged just over $10 billion over the past decade. Program wide, the premium rate, or the cost per dollar of liability, has been around 9% since the advent of revenue-based insurance.
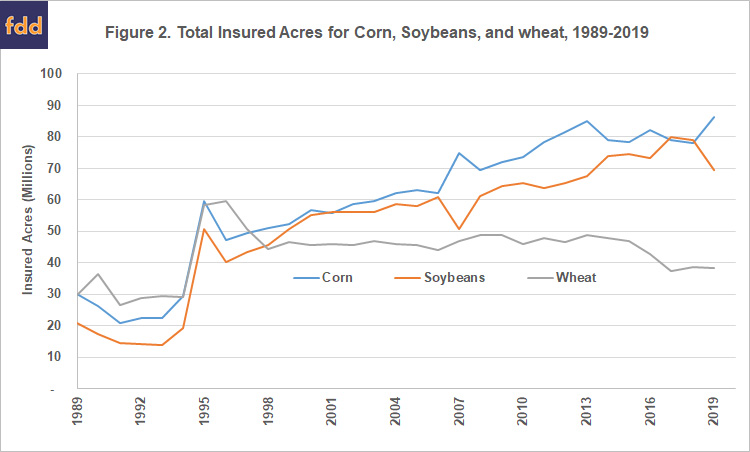
Impressively, the Federal Crop Insurance Corporation supports nearly 200 different crop/policy combinations from corn, soybeans, and wheat, to crops such as triticale, sesame, walnuts, processing pumpkins, and nearly every commercially important crop grown by US producers. The program volume is heavily concentrated in corn, soybeans and wheat however, with nearly 70% of the total program liability and premiums represented by those three crops alone, and with usage concentrated in the corn belt, and wheat growing regions.
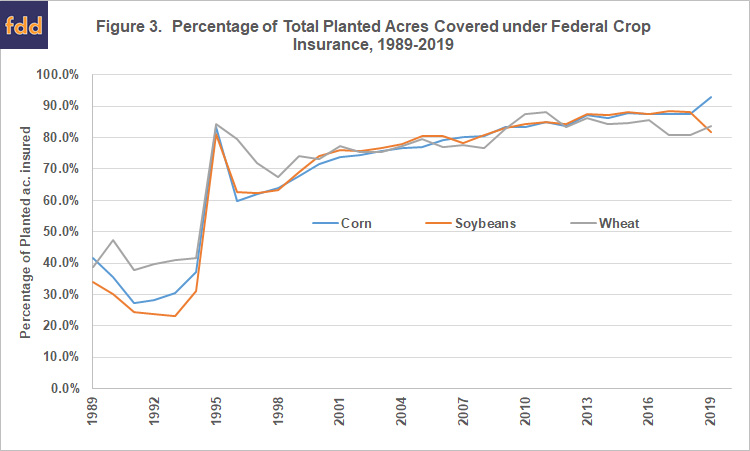
Figure 2 shows the insured acres through time for these three crops by total insured acres (both revenue and yield products), and Figure 3 shows the percentage of the total planted acres of each of these crops is insured in some form in the federal crop insurance programs. It is very impressive to see that the vast bulk of the total production is insured, and in fact, there are policy objectives that are intended to encourage participation to a point that is great enough that ad hoc disaster programs can be realistically limited. In short, crop insurance seems to be performing largely as intended in providing a meaningful safety net for the majority of commercially important acreage, especially in the major row crop regions.
Complex Farmer Decisions
The previous graphs belie the complexity of the decisions that individual producers face annually when deciding on the type, level, and units of production to insure. In general, a producer can choose to insure their farm-level production, and then choose between yield or revenue insurance; or insure with a county-level product (somewhat akin to a group policy). Within each type of insurance, there are coverage level elections from 50% to 85% in most cases for farm level products, and from 70% to 90% for county-based products. There are then unit decisions related to the aggregation of production for optional, basic, enterprise, and whole-farm insurance; and to complicate further, revenue insurance can be purchased with or without the option to increase the guarantee if prices increase. Additionally, many insurance payments related to other federal program payments based on coverage (e.g. supplemental coverage options), and thus the total relationship to revenue risk extends beyond the insurance coverage chose. Finally, there are then a dizzying number of private product add-ons that allow options such as determination of the indemnity price on an interval other than that provided for in the federal product, or rearrangement of insured units, or the ability to buy-up the indemnity price or coverage level, and so forth. Conservatively, if one considers only the coverage level, practice options, the choice of farm or group policy, coverage factors in group products, and the unit structure, most producers have well over 100 possible policy choices each year. While the vast majority of producers of the major row crops choose some form of revenue insurance, the cost per acre depends directly on previous production experience, and on the level of coverage (which determines the underlying subsidy structure as well). Moreover, every single county has a different rate structure and the rates paid by individuals in each county further depend on both coverage level differentials and production ratios relative to county expected levels. Finally, the prices for both the premiums and the indemnification are determined in windows each year based on futures prices and local time windows for averaging. For example, corn projected prices in much of the corn belt are determined by averaging the futures prices on the December contract during trading days in February, with the volatility factor calibrated to the final five trading days’ outcomes.
farmdoc Tools in response
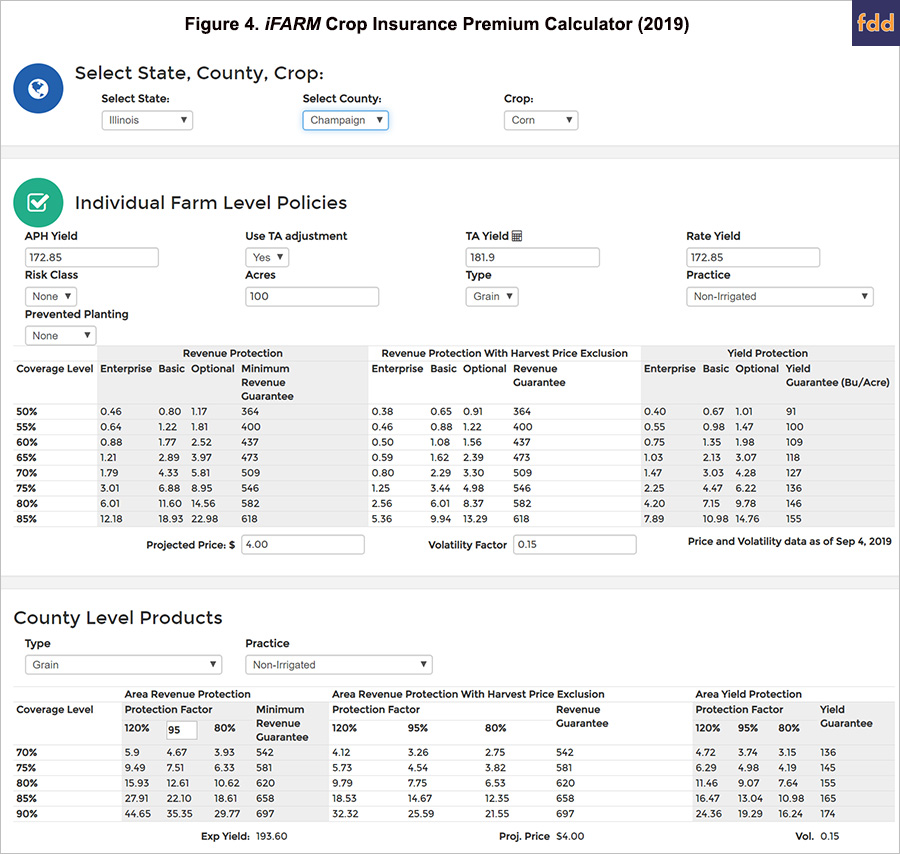
Sound confusing? It can be – and that fact led to the development of the farmdoc tools highlighted in this post. At the core of the problem is the ability to quickly compare prices across products available to a producer in a given location with a specific background experience, with myriad other conditions determined by the producer and in most cases in a short window of time around the two-week window during which most insurance can be purchased annually. Fortunately, one of the major crop insurance tools available at the farmdoc website is a quoting system that dramatically simplifies the quoting difficulties. Each spring, farmdoc provides updated and complete one-stop quoting software to allow a producer to compare virtually all possible combinations of insurance and coverage for their own farm situation. First released in 2001, the iFARM Crop Insurance tools have now been accessed and used literally several million times over the years by producers, agents, and others interested in quick and concisely organized quotes for their own cases.
Figure 4 below shows a case for Champaign County Illinois for one of the most extensively utilized tools in the form of the iFARM Crop Insurance Premium Calculator (tool available here). This type of information would take hours upon hours to recreate one quote at a time using other commonly provided methods; and thus, the intent was to allow producers to have ready and free access to as much information as needed to become fully informed about their crop insurance choices and options. The calculator is available for the vast majority of the central US and has over 800 county cases included. Additionally, the basic architecture has been broadly distributed for others to use in developing their own versions of their quoter systems, but the on-line iFARM version remains one of the most extensively used tools at our site. As can be seen in the figure below, the user enters only a few key pieces of information and can immediately retrieve a full array of indicative quotes for virtually all the most popular combinations of crop insurance products and coverage options available. Given the incredibly compressed time period (generally two weeks) each spring during which crop insurance purchases are completed, having timely and easily accessed information provided in an easily interpreted format is viewed as a very meaningful contribution. (A downloadable version of the quoter is also available for those who need to be able to access the information when not on-line.)
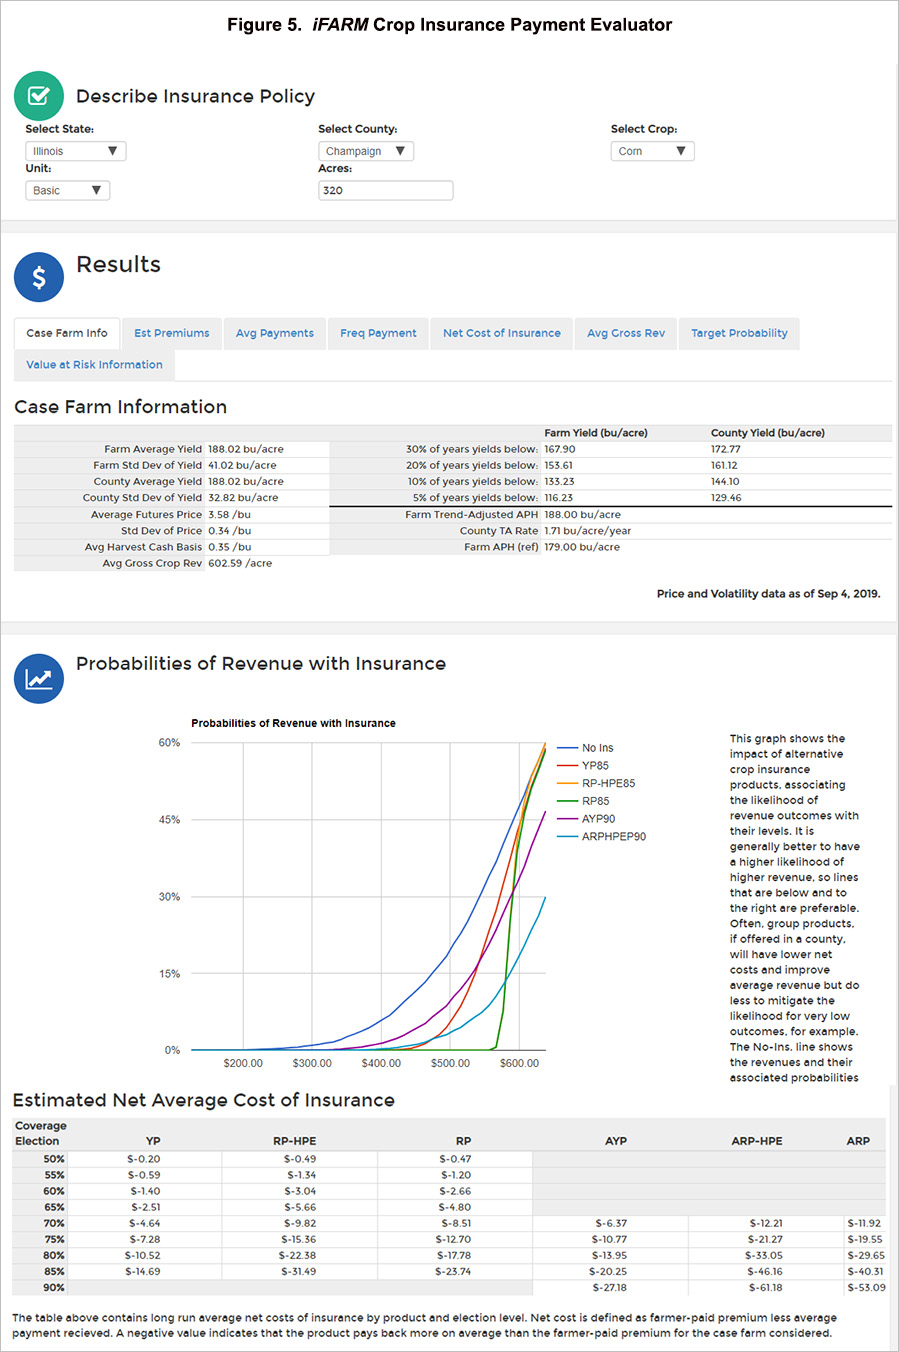
While the premium and guarantee information provided by the tool dramatically reduced the “search cost” and information asymmetry around crop insurance costs by location and circumstance, producers also consistently asked for information to evaluate the implications of different types of coverage. Early educational seminars could allow an audience at a time to see, for example, that many of the group products actually paid much more than they cost through time depending on location, but that the payments were less correlated with on-farm revenue shortfalls than were the revenue products with harvest price options for guarantee increases. This persistent line of inquiry led to the development of one of the largest scale crop insurance simulation programs known to exist at the time of its deployment, and to this date remains one of the most extensive analytical tools for crop insurance available for free. Figure 5 below shows just a couple of example screen shots for the Champaign county case identified above. (approximately 800 other counties are available here) The Crop Insurance Payment Evaluator has been migrated from a set of individual computers to be now run on the National Center for Supercomputing Applications (NCSA). It performs a large scale numeric simulation utilizing estimated price and yield distributions for the on-farm case evaluated against the actual crop insurance products being offered each year and then provides the user with a set of outputs including information on the likelihood of payment, the size of expected payments, the correlation with crop revenue, the net cost of insurance through time, and probabilistic information about the likelihood of achieving different revenue outcomes with each option of insurance. Producers with less concern about a specific year’s revenue might opt for example for the highest average payback, while a producer with concern about specific cash flow requirements might choose the option to maximize the likelihood of achieving that goal. Again, the purpose of the development and deployment of the tool was to respond to producer needs with a high quality and complete source of objective information that a producer can access on their own time to help improve the quality of their crop insurance usage decisions.
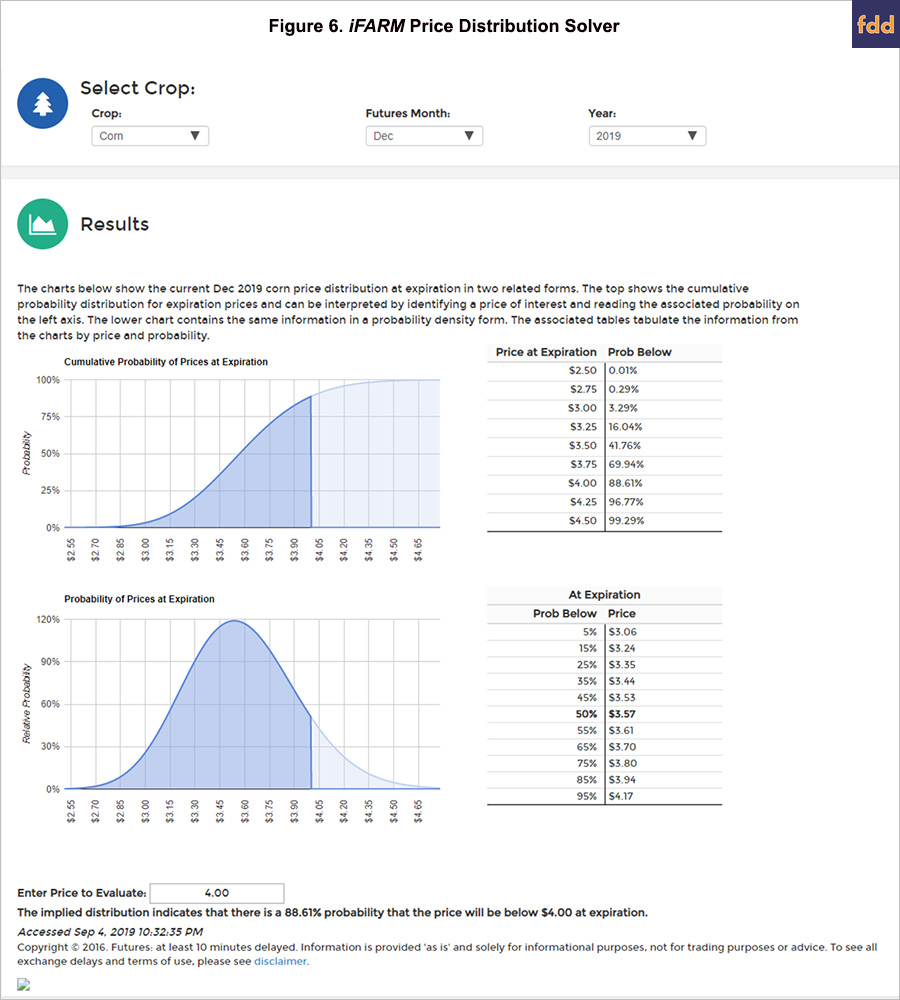
Finally, after insurance has been purchased, but before harvest, producers are critically interested in pricing of their crops and in the potential for different price outcomes after the production is in a situation that it can be “priced”. Many marketing and price information services exist, and producers have access to near real time futures price data at the touch of a screen in most cases. What seemed to be missing, however, was the ability to quickly assess probabilistic information about price movements. For example, if the current futures prices for December corn is $3.60, what is the likelihood that it will be above the $4 projected price by expiration, or what is the probability of a decline of more than $.10. To address this type of information, another tool was developed that uses a broad array of traded option information to deduce the market’s aggregate “beliefs” about the likelihood of price changes and provides producers and others with both a visual display of the uncertainty inherent in the market, and a means to test the likelihood implicit in market prices of price movements to specific levels. The tool focusses on corn and soybeans and for the major traded months most relevant to the settlement of crop insurance, and provides tabulations of the likelihood of prices and of the prices at pre-tabulated probabilities in near real time from market prices. A screen shot is provided below showing the tool (available here) for December corn as of September 4, 2019 at the close. For convenience in evaluating crop insurance, the projected price of $4.00 was entered in the evaluation box near the bottom of the page. In this case, the market currently views the likelihood of the price at expiration exceeding the projected price (and thus for the Harvest Price option to be in effect) to be about 11.39%, or the probability for prices being at or below $4.00 of being 88.61%. This tool solves for these likelihoods using a fitting routine across all traded options that results in the lowest overall pricing error within the current market prices. As such, it provides a reasonably defensible representation of the likelihoods and equivalently, the risk price of insuring against price movements of a given magnitude.
The upper portion of the graph shows the likelihood of prices being at or below pre-tabulated price levels, and the lower section shows equivalently, the prices at pre-tabulated probabilistic levels. Producers and marketing professionals use this tool to assess the changing probabilities of price movements around significant market events as well.
In addition to these standing tools, we have built dozens of other specific use “toolkits” and applications to support producers’, crop insurance professionals, and policy-makers’ needs for objective and reliable information related to crop insurance, and we intend to continue to create and maintain the most extensive suite of crop insurance evaluation tools possible as the program continues to evolve to meet producer needs.
For the past 20 years, the iFARM Crop Insurance Tools were intended to provide producers with insights needed to make informed crop insurance decisions most suitable for their own operations. We believe that the farmdoc family of websites provides an incredibly convenient platform for the ever evolving two-directional communication that identifies meaningful questions, and helps provide resources to address the needs of our broad set of stakeholders.
We look forward to continuing to serve the agricultural community for the next 20 years and beyond.
Visit the crop insurance tools section of farmdoc on the web at: http://farmdoc.illinois.edu/cropins/
farmdoc daily 20th Anniversary Celebration Series
Irwin, S. “farmdoc at 20: How Did We Get Here and What Have We Learned?” farmdoc daily (9):163, Department of Agricultural and Consumer Economics, University of Illinois at Urbana-Champaign, September 3, 2019.
Hubbs, T. “Grain Price Outlook: farmdoc Twentieth Anniversary.” farmdoc daily (9):164, Department of Agricultural and Consumer Economics, University of Illinois at Urbana-Champaign, September 4, 2019.
Sherrick, B. and G. Schnitkey. “farmdoc and farmdoc daily Crop Insurance Contributions – 20 years and Counting.” farmdoc daily (9):165, Department of Agricultural and Consumer Economics, University of Illinois at Urbana-Champaign, September 5, 2019.
Coppess, J., C. Zulauf, N. Paulson and G. Schnitkey. “Farm Policy Perspectives: 20th Anniversary of the farmdoc Project.” farmdoc daily (9):166, Department of Agricultural and Consumer Economics, University of Illinois at Urbana-Champaign, September 6, 2019.
Schnitkey, G., D. Lattz, P. Ellinger, B. Sherrick and R. Batts. “Farm Management in farmdoc.” farmdoc daily (9):167, Department of Agricultural and Consumer Economics, University of Illinois at Urbana-Champaign, September 9, 2019.
Irwin, S. and D. Good. “Biofuels Markets and Policy: 20th Anniversary of the farmdoc Project.” farmdoc daily (9):168, Department of Agricultural and Consumer Economics, University of Illinois at Urbana-Champaign, September 10, 2019.
Baylis, K. and J. Coppess. “Farmdoc 20 Year Retrospective on Agricultural Trade (In Chart Form).” farmdoc daily (9):169, Department of Agricultural and Consumer Economics, University of Illinois at Urbana-Champaign, September 11, 2019.
Endres, A., D. Uchtmann and G. Hoff. “Law and Taxation: A Retrospective of 20 Years.” farmdoc daily (9):170, Department of Agricultural and Consumer Economics, University of Illinois at Urbana-Champaign, September 12, 2019.
Paulson, N. and B. Sherrick. “farmdoc and farmdoc daily: Farm Real Estate Markets – 20 Years and Growing.” farmdoc daily (9):171, Department of Agricultural and Consumer Economics, University of Illinois at Urbana-Champaign, September 13, 2019.
Disclaimer: We request all readers, electronic media and others follow our citation guidelines when re-posting articles from farmdoc daily. Guidelines are available here. The farmdoc daily website falls under University of Illinois copyright and intellectual property rights. For a detailed statement, please see the University of Illinois Copyright Information and Policies here.