


Farmdoc 20 Year Retrospective on Agricultural Trade (In Chart Form)
This is the seventh in a series of articles celebrating the 20th anniversary of farmdoc. A list of all nine articles in the series and authors can be found at the end of this article.
For some of us, 1999 doesn’t feel like it was that long ago. We were two years into the Asian financial crisis, and commodity prices were in the dumps. We were watching the release of the Matrix, living la vida loca while worrying whether modernity was about to collapse with Y2K. Near the end of the year, we saw riot police and protesters clash at the “battle in Seattle”. Numerous NGOs representing environmentalists, sustainable development, labor, and anti-globalization activists took to the street to protest the beginning of the current round of WTO trade talks, and their perceived exclusionary nature. Up until then, it felt like the march to global free trade was inevitable, but protesters raised concerns particularly about the non-tariff components of trade deals, such as intellectual property rights or investment protections as well as governance and inequality. These protests foreshadowed the north-south divide that has come to define the current round of trade negotiations. Two years later, the talks restarted in Doha, and have been limping along ever since. While much has been decided (such as eliminating export subsidies, reducing caps on tariffs and domestic support), a number of sticking points have kept the global trading system from getting a new deal.
Trade liberalization continued to quietly move ahead since the ill-fated Seattle ministerial meeting. With the multilateral trade talks stalled, bilateral and regional trade agreements have proliferated, with the U.S. signing 12 since 1999, and the EU, 18. (See Figure 1). For the U.S., these agreements have included treaties with Australia, South Korea, Chile, Colombia, Peru and a regional agreement with many Central American and Caribbean countries. Average tariff rates have followed suit, dropping to just slightly over 5% in 2017 (World Bank).

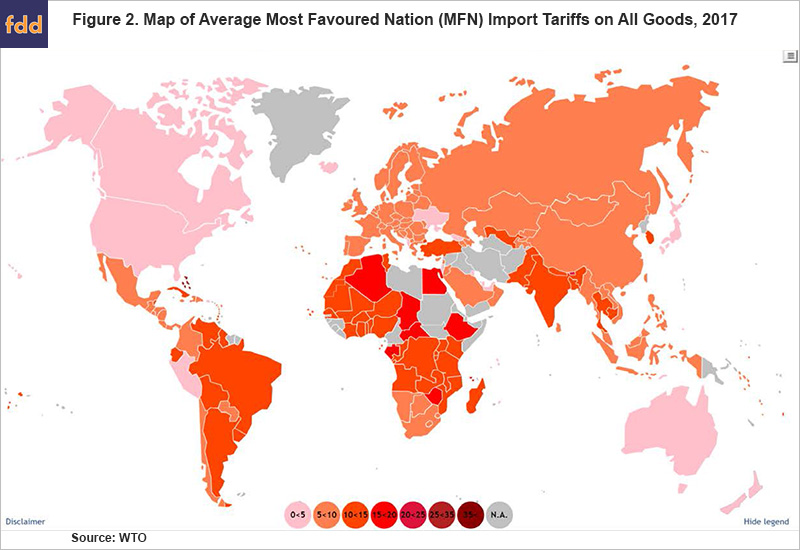
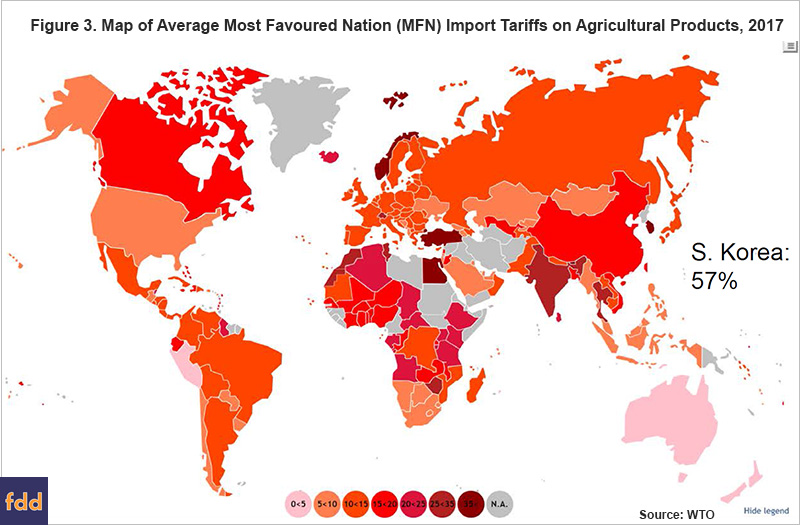
Agriculture was relatively late to the trade agreement game, and reductions in tariffs on agricultural products lag those in other sectors. Before the Uruguay round of the Global Agreement on Tariffs and Trade GATT), agriculture was largely excluded from trade talks since it was seen to be such a politically sensitive sector. Many countries wanted to protect their producers in the name of domestic food security, which had made agricultural tariffs and distorting domestic subsidies very difficult to change. With the 1995 WTO, changes to the EU Common Agricultural Program along with the 1996 Farm Bill, agriculture, particularly in much of the developed world, dramatically moved away from price supports, import protection and export subsidies, to rely more on risk management tools and, at least at first, direct payments. That said, there is more room for movement. Despite agricultural import tariffs having fallen since the Uruguay Round Agreement on Agriculture, they are still high compared to tariffs on other goods (see Figures 2 and 3: South Korea has the highest average agricultural import tariff at 57%.)
Other large shifts in agricultural trade were generated by the entry of China into the WTO in late 2001. While it has generated controversy and, ultimately, sparked the trade conflict initiated by this Administration, trade liberalization with China has been very positive for American agricultural exports, as we’ve highlighted in earlier farmdoc reports.
U.S. farmers and agricultural exports responded to this more open trading regime. U.S. agricultural exports have increased about 3.5% per year in real dollar terms since 1999 (Figure 4). Imports of agricultural products have also increased, but agriculture remains one sector where the U.S. has a trade surplus. This past twenty years followed almost 10 years of little real growth in U.S. agricultural exports. This relatively flat export growth came despite large increases in agricultural export value to Canada and Mexico (4.4% real growth per year from 1990 to 1999) and high growth to Central and South American markets. These increases were offset with drops in exports to east and southeast asian economies who were suffering from the currency crisis.

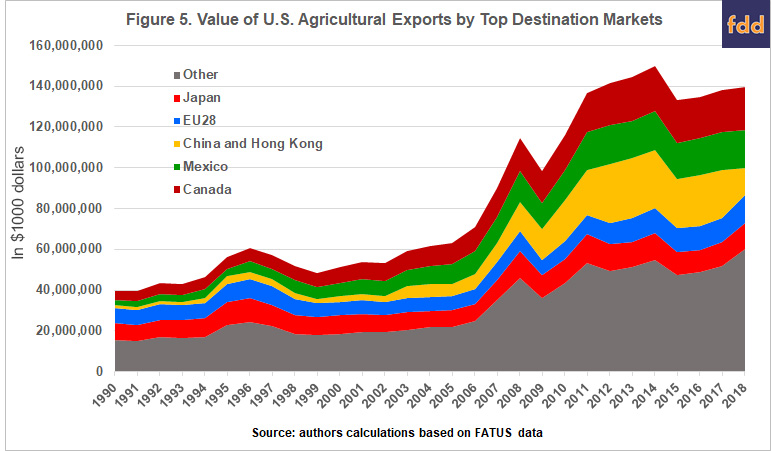
The past twenty years of export growth and trade agreements means that in 2018, our primary export markets were our two NAFTA (USMCA) trading partners, followed by China, which together take about 40 to 45 percent of total US agricultural exports. All three markets have grown dramatically since 1990. China dropped from being the was the largest market in 2017, which can be seen in Figure 5. After that the EU and Japan are our two next largest markets, but the value of U.S. agricultural products that they import has risen much more slowly over the past 20 to 30 years than our top three markets, and more slowly than exports to other countries.
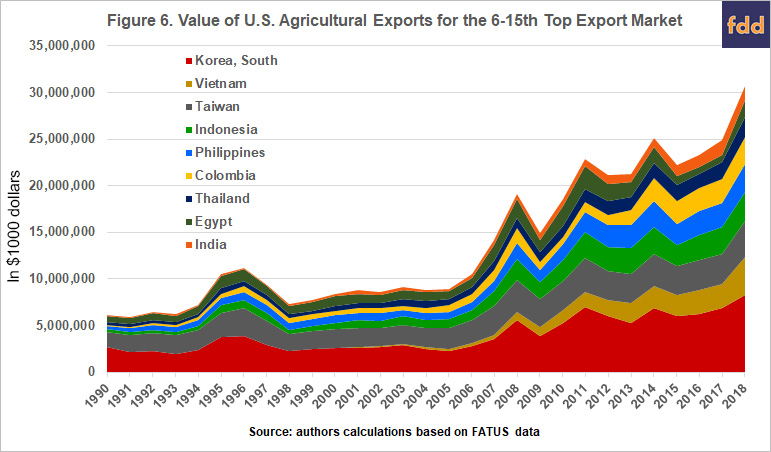
Potentially more of a surprise are the next 9 largest export markets for U.S. agriculture, many of which have grown rapidly in recent years. Notably the U.S. signed bilateral trade agreements with two of these markets, Colombia and South Korea in 2012, and with Australia in 2004, the next largest export market for the U.S. after those countries (Figure 6).
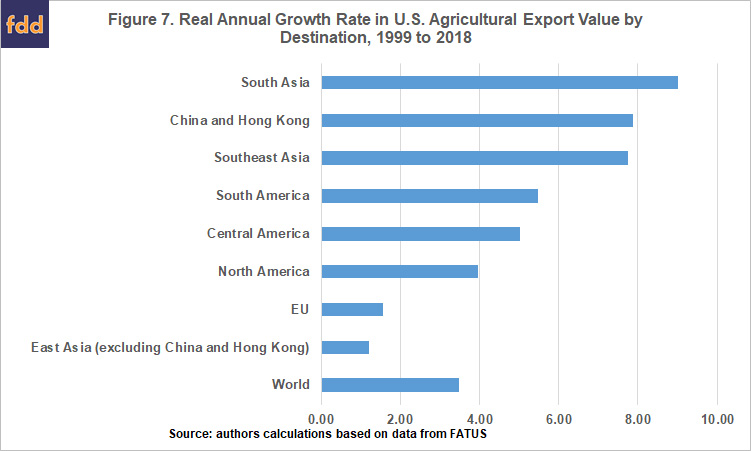
In summary, since 1999, growth in U.S. agricultural exports has picked up, in particular to developing country markets. As can be seen from Figure 7, from 1999 to 2018, the fastest growing export market region was South Asia, followed by China and Southeast Asia. If instead we use 2017 as the end point, China and Hong Kong would be in the lead, with an annual growth in U.S. ag export value of over 12%, but with the trade dispute, their imports are down substantially in 2018.
The other big change in the last twenty years has been what we export. We have seen a large growth in intermediate and consumer products exports – for example meat (as noted in our earlier farmdoc article from 2017). While bulk exports (grains and oilseeds) are still very important, consumer-oriented products have now overtaken them in export value (see Figure 8).

Now in 2019 we’re in the situation of having (still) stalled multilateral negotiations, while fighting trade disputes on several fronts, with agriculture facing the brunt of the tariff salvos (see prior farmdoc reports: August 2018; April 2018). The march towards free trade does not feel as assured as it might have 20 years ago, at least from the vantage point of the United States. Meanwhile, our trading partners are not standing still. The EU signed a trade agreement with Japan last year, and Canada two years before that, and in June of this year, just announced an agreement with Mercosur. The trans-pacific partnership is underway without the U.S., and the EU is currently in negotiations with Australia and New Zealand, along with its existing agreements with a number of ASEAN countries, and both New Zealand and Australia have free trade agreements with China. While the last 20 years have shown us some dramatic changes in what we export and to whom, the next few years could well dictate how secure those markets are for U.S. agriculture in the years to come.
References
BBC News. “EU and Mercosur agree huge trade deal after 20-year talks.” June 28, 2019. https://www.bbc.com/news/world-europe-48807161
Burak, S., K. Baylis, J. Coppess and Q. Xie. “A Looming Trade War – An Illinois Ag Perspective.” farmdoc daily (8):69, Department of Agricultural and Consumer Economics, University of Illinois at Urbana-Champaign, April 18, 2018.
Paulson, N., K. Baylis, J. Coppess and G. Schnitkey. “Another Look at Agricultural Trade: Direct and Indirect Corn Exports.” farmdoc daily (7):53, Department of Agricultural and Consumer Economics, University of Illinois at Urbana-Champaign, March 23, 2017.
Swanson, K., G. Schnitkey, T. Hubbs, J. Coppess, N. Paulson and C. Zulauf. “Impacts of Chinese Soybean Tariffs on Financial Position of Central Illinois Grain Farms.” farmdoc daily (8):68, Department of Agricultural and Consumer Economics, University of Illinois at Urbana-Champaign, April 17, 2018.
Zulauf, C., J. Coppess, N. Paulson and G. Schnitkey. “The Tariff Conflict and Change in Value of Production of U.S. Field Crops.” farmdoc daily (8):153, Department of Agricultural and Consumer Economics, University of Illinois at Urbana-Champaign, August 16, 2018.
farmdoc daily 20th Anniversary Celebration Series
Irwin, S. “farmdoc at 20: How Did We Get Here and What Have We Learned?” farmdoc daily (9):163, Department of Agricultural and Consumer Economics, University of Illinois at Urbana-Champaign, September 3, 2019.
Hubbs, T. “Grain Price Outlook: farmdoc Twentieth Anniversary.” farmdoc daily (9):164, Department of Agricultural and Consumer Economics, University of Illinois at Urbana-Champaign, September 4, 2019.
Sherrick, B. and G. Schnitkey. “farmdoc and farmdoc daily Crop Insurance Contributions – 20 years and Counting.” farmdoc daily (9):165, Department of Agricultural and Consumer Economics, University of Illinois at Urbana-Champaign, September 5, 2019.
Coppess, J., C. Zulauf, N. Paulson and G. Schnitkey. “Farm Policy Perspectives: 20th Anniversary of the farmdoc Project.” farmdoc daily (9):166, Department of Agricultural and Consumer Economics, University of Illinois at Urbana-Champaign, September 6, 2019.
Schnitkey, G., D. Lattz, P. Ellinger, B. Sherrick and R. Batts. “Farm Management in farmdoc.” farmdoc daily (9):167, Department of Agricultural and Consumer Economics, University of Illinois at Urbana-Champaign, September 9, 2019.
Irwin, S. and D. Good. “Biofuels Markets and Policy: 20th Anniversary of the farmdoc Project.” farmdoc daily (9):168, Department of Agricultural and Consumer Economics, University of Illinois at Urbana-Champaign, September 10, 2019.
Baylis, K. and J. Coppess. “Farmdoc 20 Year Retrospective on Agricultural Trade (In Chart Form).” farmdoc daily (9):169, Department of Agricultural and Consumer Economics, University of Illinois at Urbana-Champaign, September 11, 2019.
Endres, A., D. Uchtmann and G. Hoff. “Law and Taxation: A Retrospective of 20 Years.” farmdoc daily (9):170, Department of Agricultural and Consumer Economics, University of Illinois at Urbana-Champaign, September 12, 2019.
Paulson, N. and B. Sherrick. “farmdoc and farmdoc daily: Farm Real Estate Markets – 20 Years and Growing.” farmdoc daily (9):171, Department of Agricultural and Consumer Economics, University of Illinois at Urbana-Champaign, September 13, 2019.
Disclaimer: We request all readers, electronic media and others follow our citation guidelines when re-posting articles from farmdoc daily. Guidelines are available here. The farmdoc daily website falls under University of Illinois copyright and intellectual property rights. For a detailed statement, please see the University of Illinois Copyright Information and Policies here.